

On this page
Cohort study figure
One 183 mm page with the scientific.cell preset that uses the plot types
added after 4.1.0 together: an embedding, a dot plot, split violins,
significance brackets, survival curves with a number-at-risk table and a
forest plot. All data are simulated, and the P values are made up: no test is
run.
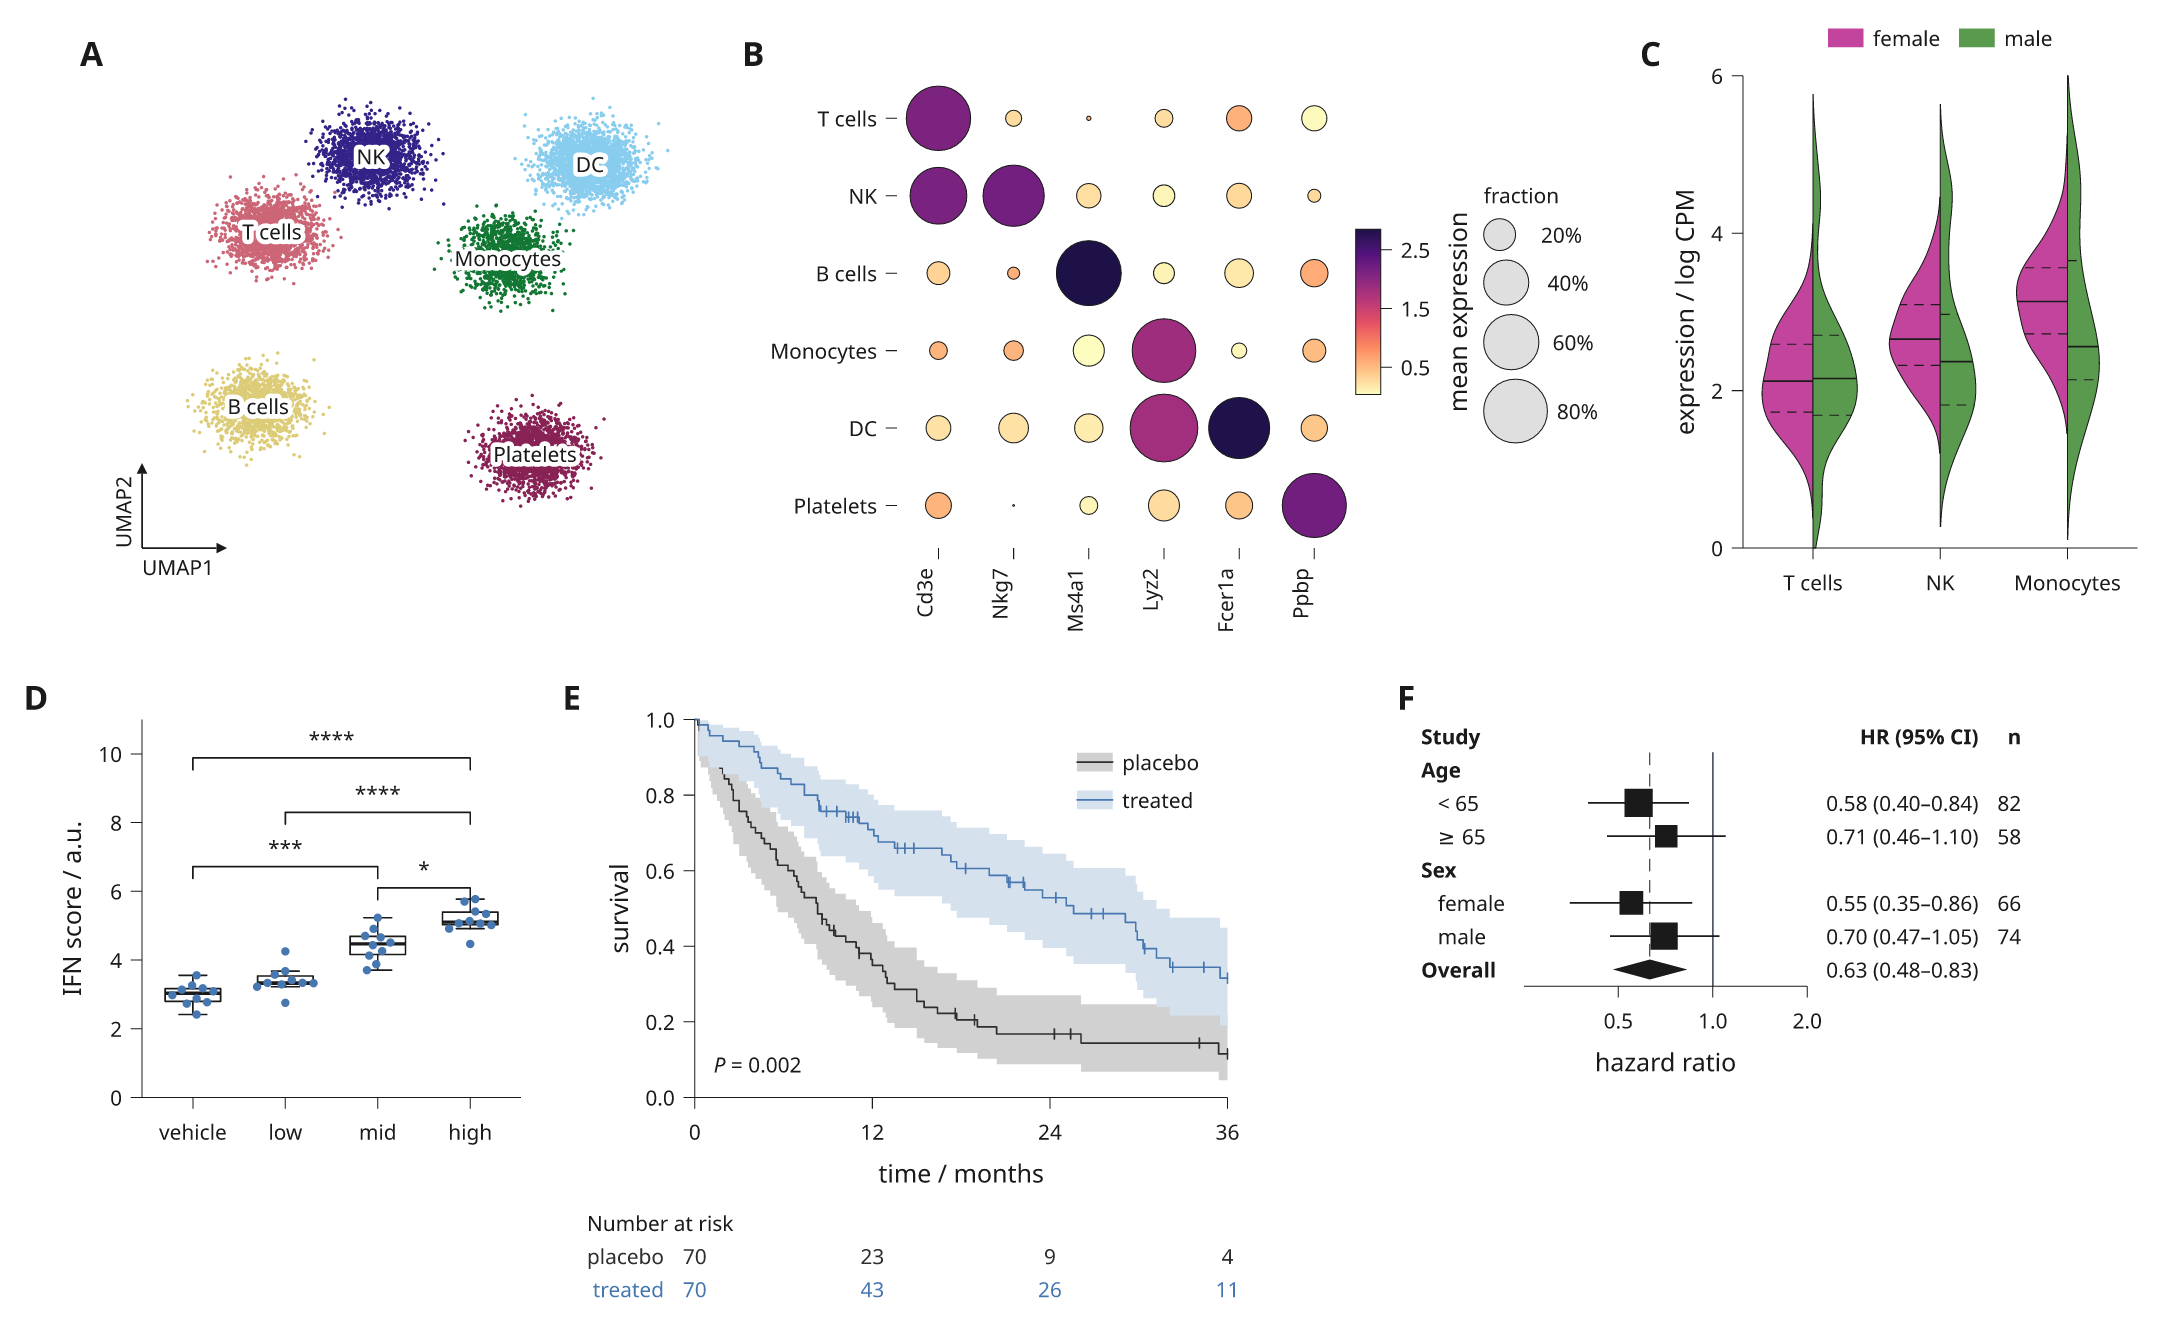
The source is examples/cohort_figure.py. It
writes out/cohort-figure/figure.svg, .pdf and .png and prints the lint
report:
python examples/cohort_figure.py
What each panel uses
| Panel | Content | Calls |
|---|---|---|
| a | Cells coloured and named by cluster, with corner arrows | embedding(arrows='UMAP'); see embedding scatters |
| b | Marker genes per cluster | dotplot(), colorbar(), size_key(); see dot plots |
| c | One gene by sex in three clusters | split_violin(quartiles=True); see split violins |
| d | Response by dose | boxplot(), swarm(), brackets(hide_ns=True); see significance brackets |
| e | Two trial arms | kaplan_meier(pvalue=...), at_risk(); see survival curves |
| f | Hazard ratios by subgroup | inklet.forest(log=True); see forest plots |
Panels a to e are plot specs in a 12-column document, so they share data edges along each row. The forest plot is a diagram with its own text columns. It goes in as a component, built when the page compiles, so the preset's type sizes apply to it.
For a step-by-step build of a whole page, see rebuild a journal figure.