

On this page
Reusable compositions
Use a composition when the same figure structure needs different content: a response plot above a caption, a method diagram beside results, or a report repeated for several experiments. Define named slots and measured placement once, then instantiate the layout with plots, diagrams, images or native 3D components. Each instance keeps its own author choices and shares explicit live data dependencies.
This tutorial creates two report instances, revises their shared data and exports one at a second width. It uses the published 4.9.0 release and the core installation. Run the Python blocks in order. Start with plot recipes for marks inside one plot, or panel layout for document rows and columns.
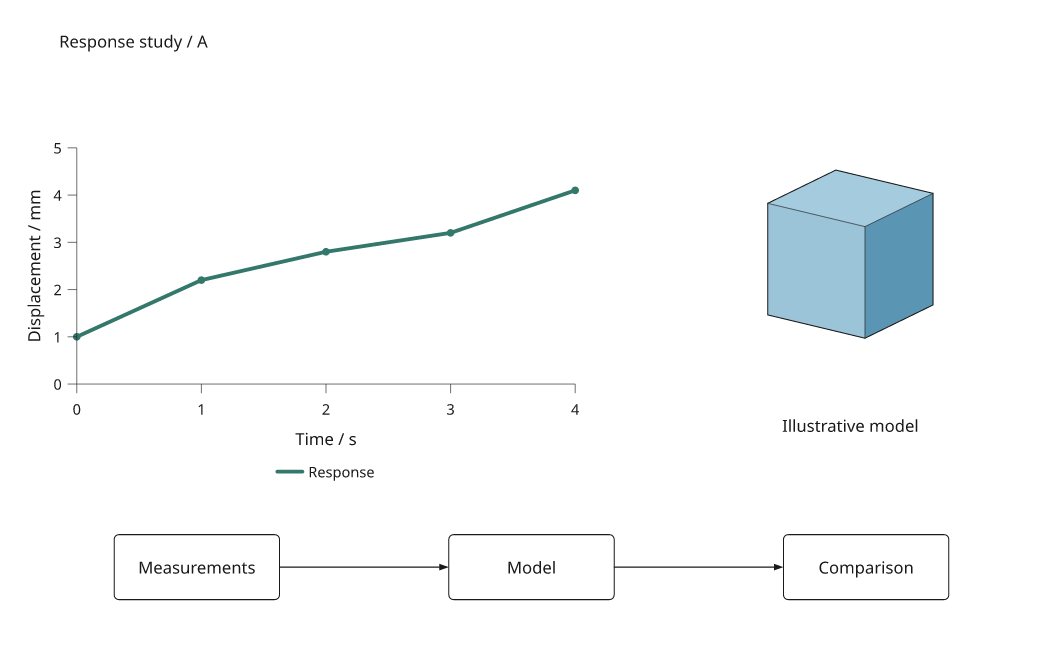
The complete example instantiates one layout twice, changes plot styles, geometry and module labels, exports both at 180 and 150 mm, then updates their shared measurements. The inputs are illustrative data and generated geometry.
Open the standalone figure viewer. The viewer supports exploration; these placement and content edits are made in Python or through the local layout inspector.
Declare inputs and defaults
slot() accepts the same placement options as add(). Slots are required;
ordinary children are defaults that an instance may replace. Dimensions and
expressions use the composition's coordinate unit, one millimetre by default.
Plot width and height describe the data region, keeping text and strokes at
their authored physical size.
import inklet as i

recipe = i.composition(120, 70)
recipe.slot('chart', x=13, y=8, anchor='area-nw',
            width=recipe.page_width - 26, height=30)
recipe.add('caption', i.module('Response', pad=2), x=13, y=55)
recipe.port('output', 'caption:out')
recipe.constrain(recipe.page_width, minimum=80,
                 message='response panel needs at least 80 mm')

data = i.dataset({'x': [0, 1, 2], 'y': [1, 2, 3]})
chart = i.plot_spec(x=(0, 2), y=(0, 5))
chart.line(data.points('x', 'y'), stroke='#34786b', key='response')
chart.axes(x='Time', y='Response')
first = recipe.instantiate(chart=chart)
second = recipe.instantiate(chart=chart, caption=i.module('Comparison', pad=2))
second['chart'].style('response', stroke='#aa5b36')

doc = i.document(width=120, height=70, margin=0)
doc.add('report', first)
before = doc.compile()
before.save('composition.svg', 'composition.pdf')
Missing inputs and unknown names raise LayoutError before an instance is
created. Compiling an unfilled template identifies its unbound slot. Inputs
name direct children; instantiate a nested template before passing it to
its parent. A slot does not impose a content type: the chosen content must
support its placement, such as area-nw for a plot or a requested named port.
Independent edits, live inputs
instantiate() copies the template and supplied supported recipes. copy()
creates another independent recipe without requiring slots to be filled.
Both copy nested Composition, PlotSpec, ModuleSpec and ComponentSpec
definitions, their literal containers and NumPy arrays. Repeated references
to one definition remain shared within the copy.
Explicit data references, shared scales, Series, static Diagrams, component
factories and other BuildSpecs retain their original identity. External
objects are not cloned. Use component() with explicit arguments for a
reusable factory and FileRef for an asset whose file changes should trigger
rebuilding; see images and 3D and live data.
second['caption'].configure('Independent label')
second.place('caption', x=18)
second.configure(width=140)
# Future changes to the original chart's style do not reach either instance.
chart.style('response', stroke='#000000')
assert doc.compile() is before

old_svg = before.to_svg()
data.update(y=[2, 3, 4])
after = doc.compile()
assert after.to_svg() != old_svg
assert before.to_svg() == old_svg
assert doc.compile() is after
place() changes placement fields: x, y, anchor, width, height and
scale. Explicit scale uniformly scales complete artwork, including
text and strokes; it is separate from fitting a plot to a new width/height.
Set anchor, width or height to None to restore their unspecified behavior.
replace() replaces content and keeps its placement and named relationships.
Dimension updates through configure() validate before mutation; expressions,
minimum-space constraints and referenced anchors are checked at compilation.
The containing document may supply a different render size, so use page
expressions for responsive placement rather than scaling a finished drawing.
Export a second instance at another width
The template positions its plot using page_width - 26: 13 mm of room on each
side. Render the second instance at 140 mm and its data region becomes 114 mm
wide. The 30 mm data-region height, label sizes and stroke widths stay fixed.
wide = i.document(width=140, height=70, margin=0)
wide.add('report', second)
wide_figure = wide.compile()
wide_figure.save('composition-wide.svg', 'composition-wide.pdf')
assert wide_figure.root.width == 140
assert doc.compile().root.width == 120
Compare this export with composition.svg: the wider plot uses the independently
styled line and revised measurements, and its caption reads “Independent label.”
Changing the available page width recomputes layout expressions. For a template
with longer labels, add minimum-width constraints that reflect those labels.
Expose attachment points through nested compositions
port(name, target) exposes a child's compass point or registered anchor.
Parent compositions can use it in point(), link(), annotate() and
placement anchors just like a module port. Replacing a child or changing its
label or position moves the attachment point when the document rebuilds.
parent = i.composition(180, 80)
parent.add('report', first, x=0, y=0, width=120, height=70)
x, y = parent.point('report', 'output')
parent.add('next', i.module('Next step'), x=x + 12, y=y, anchor='in')
parent.link('report:output', 'next:in')
outer = i.document(width=180, height=80, margin=0)
outer.add('whole', parent)
outer.compile().save('nested-composition.svg')
Names are local to each composition. A port target names a direct child,
optionally followed by :anchor; omitting the anchor uses its center. Calling
port() again with the same name changes its target. Missing child anchors
and cyclic measured dependencies produce errors instead of detached links.
Named ports also account for nested coordinate units and fit_top offsets.
Review at multiple widths
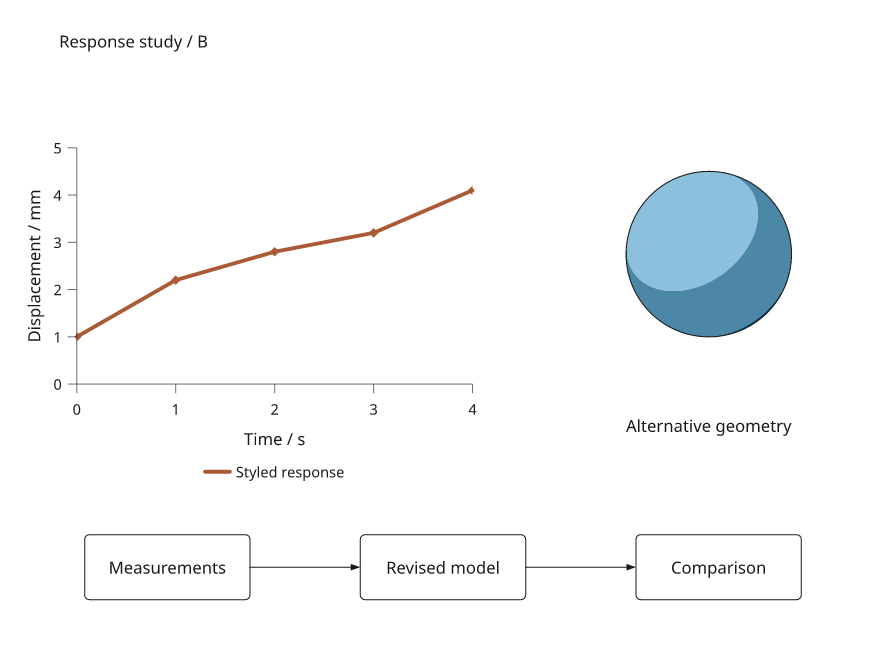
This second instance uses the same layout and data, with a different plot colour, markers, native 3D style and module label. The chart width and workflow spacing follow the available page width; the plot height, text and strokes retain their physical sizes. Templates do not automatically resolve arbitrary overlap: add measured expressions and constraints for the space your content needs. The complete example rejects widths below 140 mm.
Run python examples/composition_recipes.py --render from the checkout to
produce the SVG/PDF/PNG comparisons, standalone HTML viewers, revised-data
exports and build statistics in out/composition-recipes/. PNG requires the
render extras. The local inspector offers visual editing of
the named content in these Python recipes.
Save and restore layout choices separately from the
recipe to preserve measured expressions and report removed targets. Use
figure projects when you also need to include input files
and provenance through save, reopen and revision. Those project APIs are stable in
inklet.project since 4.3.0 and require the Python recipe when reopening.