

On this page
Replace figure data
Experimental: the API may change.
Rebuild a linked figure with revised data while retaining valid selections.
BrowserFigure.replace_data() compiles a new figure and returns its saved state
and a report of changed rows. It is available in the 4.0.0.dev1 preview under
inklet.experimental.browser and remains opt-in.
Precompiled revisions can also be embedded in one offline HTML file. Choose a target revision and transfer the current selection and filter with explicit missing-ID and viewport policies. Each revision retains its own data, measured layout, source credit and search columns.
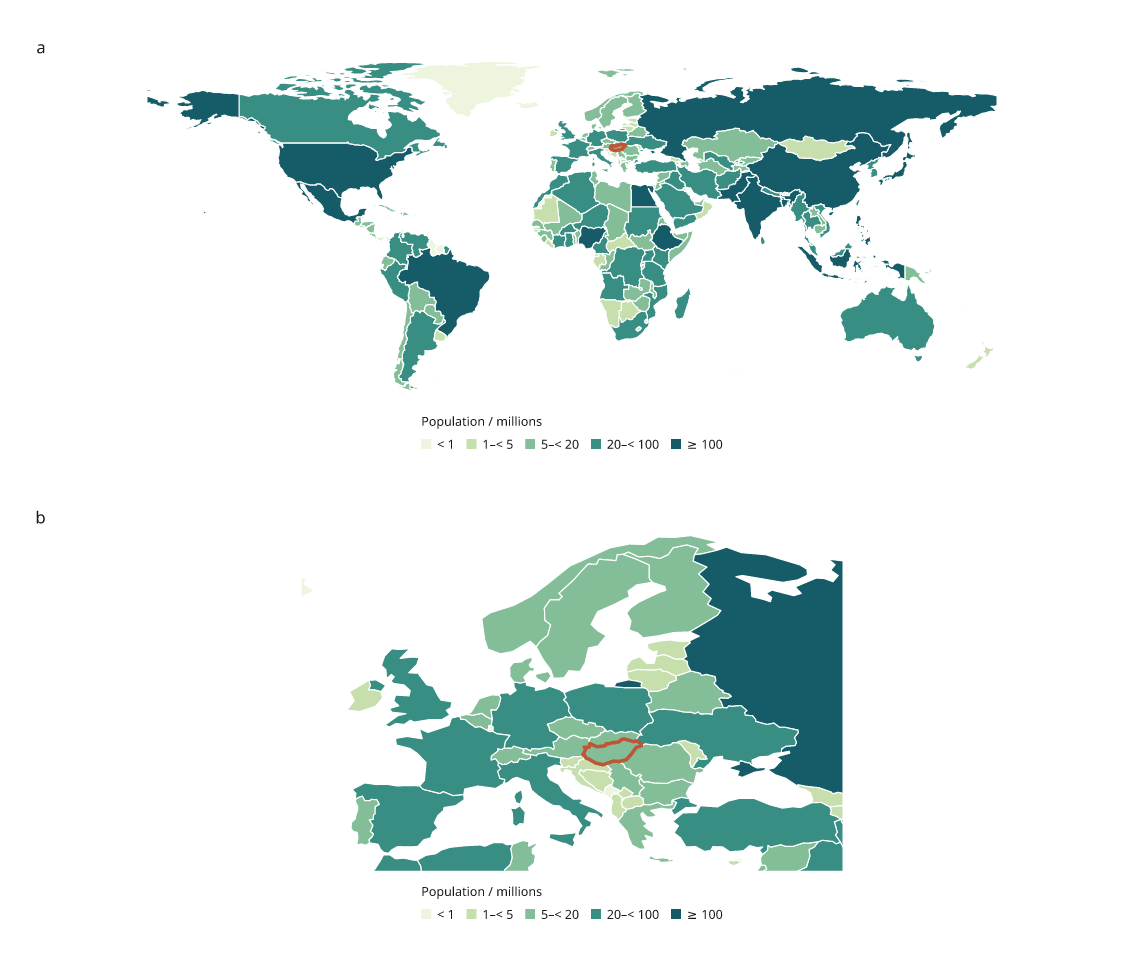
Try switching between the original and 2019 maps
Switch revisions in the browser
The demo embeds the complete 176-country map and the 169-country cohort dated 2019. It uses the same pinned Natural Earth inputs for both; surviving values are unchanged. This compares source cohorts, not population change over time.
- Open the demo and search for
TWN. Select its table row, then clear the search so all countries are visible. Taiwan's population year in this source is 2020. - Expand Data revision, choose 2019 source cohort · 169 countries and
click Apply revision with the default Removed state IDs setting.
Replacement fails because the selected
TWNis absent. The original map and selection remain available. - Choose Drop removed IDs and apply again. The map now contains 169 countries;
the report identifies all seven removed IDs and
TWNas a discarded selection. Hungary's initial selection survives. - Expand Last revision report to download its JSON, save the current view or export vector SVG. Switch back to All source years · 176 countries to restore all countries. Discarded selections are not restored automatically. An unfiltered view includes the added countries; an explicit ID filter retains its surviving IDs.
The viewport defaults to Fit new page; Keep page rectangle explicitly preserves its rectangle in page millimetres. Backend choice is retained. Source credit and the table update with the revision. A failed transfer keeps the active figure unchanged. The report describes the most recent successful transfer, rather than a cumulative history.
Generate and reconstruct the switchable example offline:
python examples/v4/world_population.py --switchable --output out/v4-switchable

# Reopen a view saved while the 2019 cohort was active.
python examples/v4/world_population.py --switchable --year 2019 \
  --state /path/to/cohort-view.json --output out/v4-restored

# Reopen a view saved while all source years were active.
python examples/v4/world_population.py --switchable \
  --state /path/to/original-view.json --output out/v4-restored
Saved-view loading still requires the exact active revision. In the browser,
switch to that revision before loading its saved view. The CLI's --year 2019
selects the cohort as the initial revision; omitting it selects the original.
Both commands write an SVG reconstructed from the chosen revision and state.
--switchable supports these two source cohorts; it cannot be combined with
--csv or other years.
Embed your own revisions
from inklet.experimental.browser import RevisionOption

# figure and revised_figure are independently compiled BrowserFigure objects.
html = figure.to_html(
    revision_label="Original observations",
    attribution="Source for original observations.",
    revisions=[RevisionOption(
        label="Corrected observations",
        figure=revised_figure,
        attribution="Source and correction details for revised observations.",
    )],
)
Provide up to seven alternatives. Revisions must share a table name and key
column; their rows, geometry and layouts may differ. Each RevisionOption can
set search_columns for its own table. This API embeds precompiled figure data
and makes no network requests. Arbitrary CSV upload and compilation inside the
browser remain future work.
A separately rebuilt map
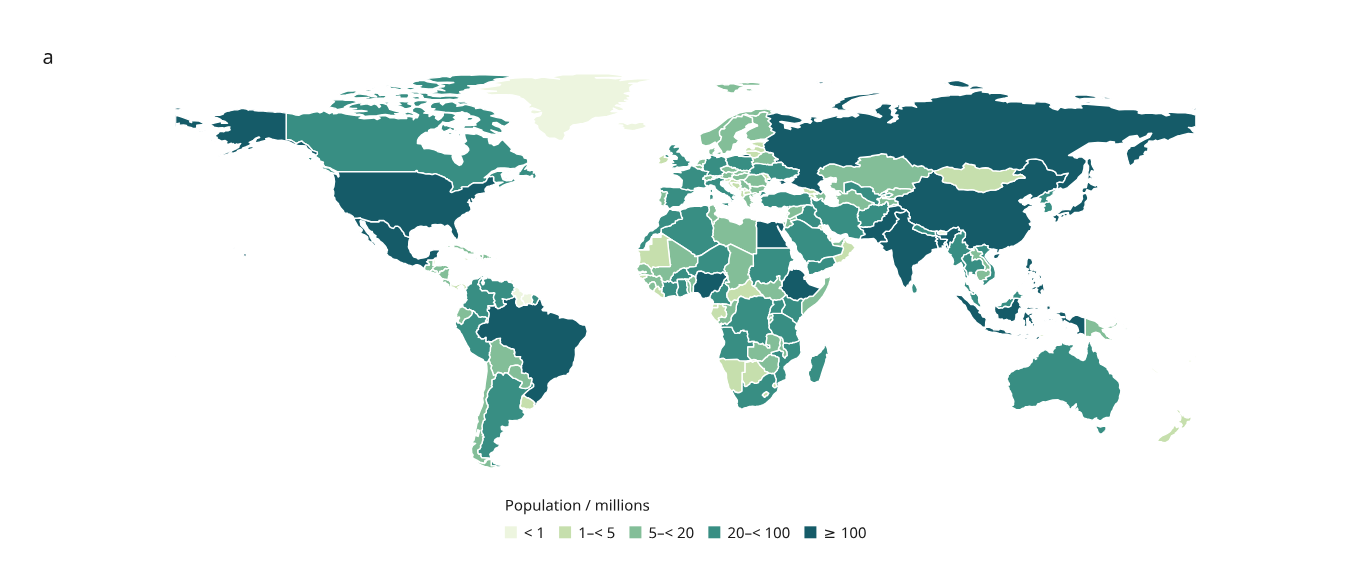
Open the revised world and Europe maps · Inspect the revision report · Python recipe
This example restricts the original Natural Earth map to the 169 rows whose population year is 2019. The seven omitted country/map units appear blank. Retained population values, boundaries and color bins are unchanged. It is a cohort from the pinned historical source, with the same public-domain attribution and geographic limitations as the original example.
A revised figure
from pathlib import Path
import json
from inklet.experimental.browser import BrowserFigure, ScatterView
from inklet.selection import KeyedTable, SelectionState

original = KeyedTable("observations", {
    "id": ["a", "b", "c"], "x": [0, 1, 2], "y": [1, 2, 3],
})
figure = BrowserFigure(original, [
    ScatterView("points", "x", "y", (0, 4), (0, 8)),
])
saved = figure.state(SelectionState.for_table(original, selected=["b"]))
revised = KeyedTable("observations", {
    "id": ["c", "b", "d"], "x": [2, 1, 3], "y": [3, 6, 4],
})

result = figure.replace_data(revised, state=saved)
Path("revised.html").write_text(
    result.figure.to_html(state=result.state()), encoding="utf-8",
)
Path("revised.svg").write_text(
    result.figure.to_svg(result.state()), encoding="utf-8",
)
Path("view.json").write_text(json.dumps(result.state()), encoding="utf-8")
Path("revision.json").write_text(json.dumps(result.report(), indent=2), encoding="utf-8")
Row b stays selected at its new coordinates. The report lists a as removed,
d as added and b as changed. It also records the changed order of surviving
rows. The original figure and state remain usable, including if replacement
fails. Returned state/report dictionaries are independent copies.
Identity, filters and layout
- Keep the table name and key column. Correspondence follows explicit row IDs.
- Removing a selected or explicitly visible ID raises an error by default.
Use
missing="drop"to remove those references and inspectremoved_selectedandremoved_visiblein the report.removed_idslists all removed rows, including rows with no saved-state references. - A visibility value of
Nonecontinues to mean all rows, including additions. An explicit ID filter retains only surviving IDs; an empty filter stays empty. Hidden selections remain selected. Search text is not part of saved state; its saved ID subset is retained without rerunning the query on new data. - Existing view definitions, fixed domains, color bins, width and column count
are reused. Pass
views=,width=orcolumns=to change them. Geometry is rebuilt in the revised source order, including line adjacency and paint order. - Map feature IDs must still join the table exactly. Supply new
RegionViewdefinitions with matchingGeoRegionswhen the cohort changes. Geometry changes affect the scene digest even if table values stay the same. - The viewport resets to the new page.
viewport="preserve"explicitly retains the old rectangle in page millimetres, subject to the new page's limits. It does not preserve a data-coordinate or geographic extent across a layout change. A rejected viewport leaves the original figure untouched.
Reports include old/new data and scene digests, added/removed/changed IDs,
added/removed columns, surviving-row order changes, discarded state references
and the chosen policies. changed_ids compares complete serialized rows;
1 and 1.0 count as different, as in the table digest. Adding or removing a
column changes every surviving row. ID lists are
sorted. The report schema is inklet.browser-revision/0.1 and remains experimental.
Ordinary state loading still requires the exact scene revision. Use replacement
explicitly to transfer an old state, then save the returned state for the new
figure. replace_data() performs this operation in Python; embedded revisions
provide the corresponding explicit transfer inside an open browser.
Try it with the real map
python examples/v4/world_population.py --year 2019 --output out/v4-revision

# Transfer a view saved from the original 176-country map.
python examples/v4/world_population.py --year 2019 \
  --rebase-state /path/to/original-view.json --missing drop \
  --output out/v4-revision

# Reopen a view saved from the revised map with the same target inputs.
python examples/v4/world_population.py --year 2019 \
  --state out/v4-revision/view.json --output out/v4-restored
The output includes index.html, the two-panel figure.svg, an unfiltered
single-panel world.svg, view.json, the effective population.csv, and
revision.json with input provenance. Choose --viewport preserve only when
you want the old page rectangle. Without an input state, Hungary starts selected.
A year cohort that excludes Hungary therefore requires --missing drop.
To supply your own table:
python examples/v4/world_population.py --csv /path/to/population.csv \
  --rebase-state /path/to/original-view.json --output out/v4-csv
The CSV requires id, country, continent, population and
population_year. IDs must be unique source country codes with known geometry;
this recipe rejects an empty cohort. Population must be finite and nonnegative;
years must be whole numbers from 1 to 9999. No numeric values may be blank.
population_millions is recalculated from population; a supplied column with
that name is ignored, as are other extra columns. Input order is retained.
The output credit identifies the supplied CSV and its SHA-256 instead of
attributing replacement values to Natural Earth. Geometry retains Natural Earth
credit. To reopen a saved view, supply the same CSV with --state; to transfer
an original map view, use --rebase-state. Those options are mutually exclusive.
Checks
Regression tests cover row edits, additions/removals, order changes, schema changes, hidden/empty filters, layout and viewport changes, failed replacements, exact region joins and the original snapshot's integrity. The real-map CLI is checked through replacement, report export and exact SVG reconstruction. Browser checks at device pixel ratios 1 and 2 verify that all three rendering backends retain the new selection, reject the old state without mutation, and export matching polygon geometry and styles.