

On this page
Dense figure pages
A journal figure page often holds a dozen small panels at 183 mm wide: a
schematic, bar charts with counts, heatmaps, cumulative distributions, a radar
chart and a donut. The scientific.cell preset sets the type sizes, strokes and
spacing for such a page, and a 12-column document places the panels.
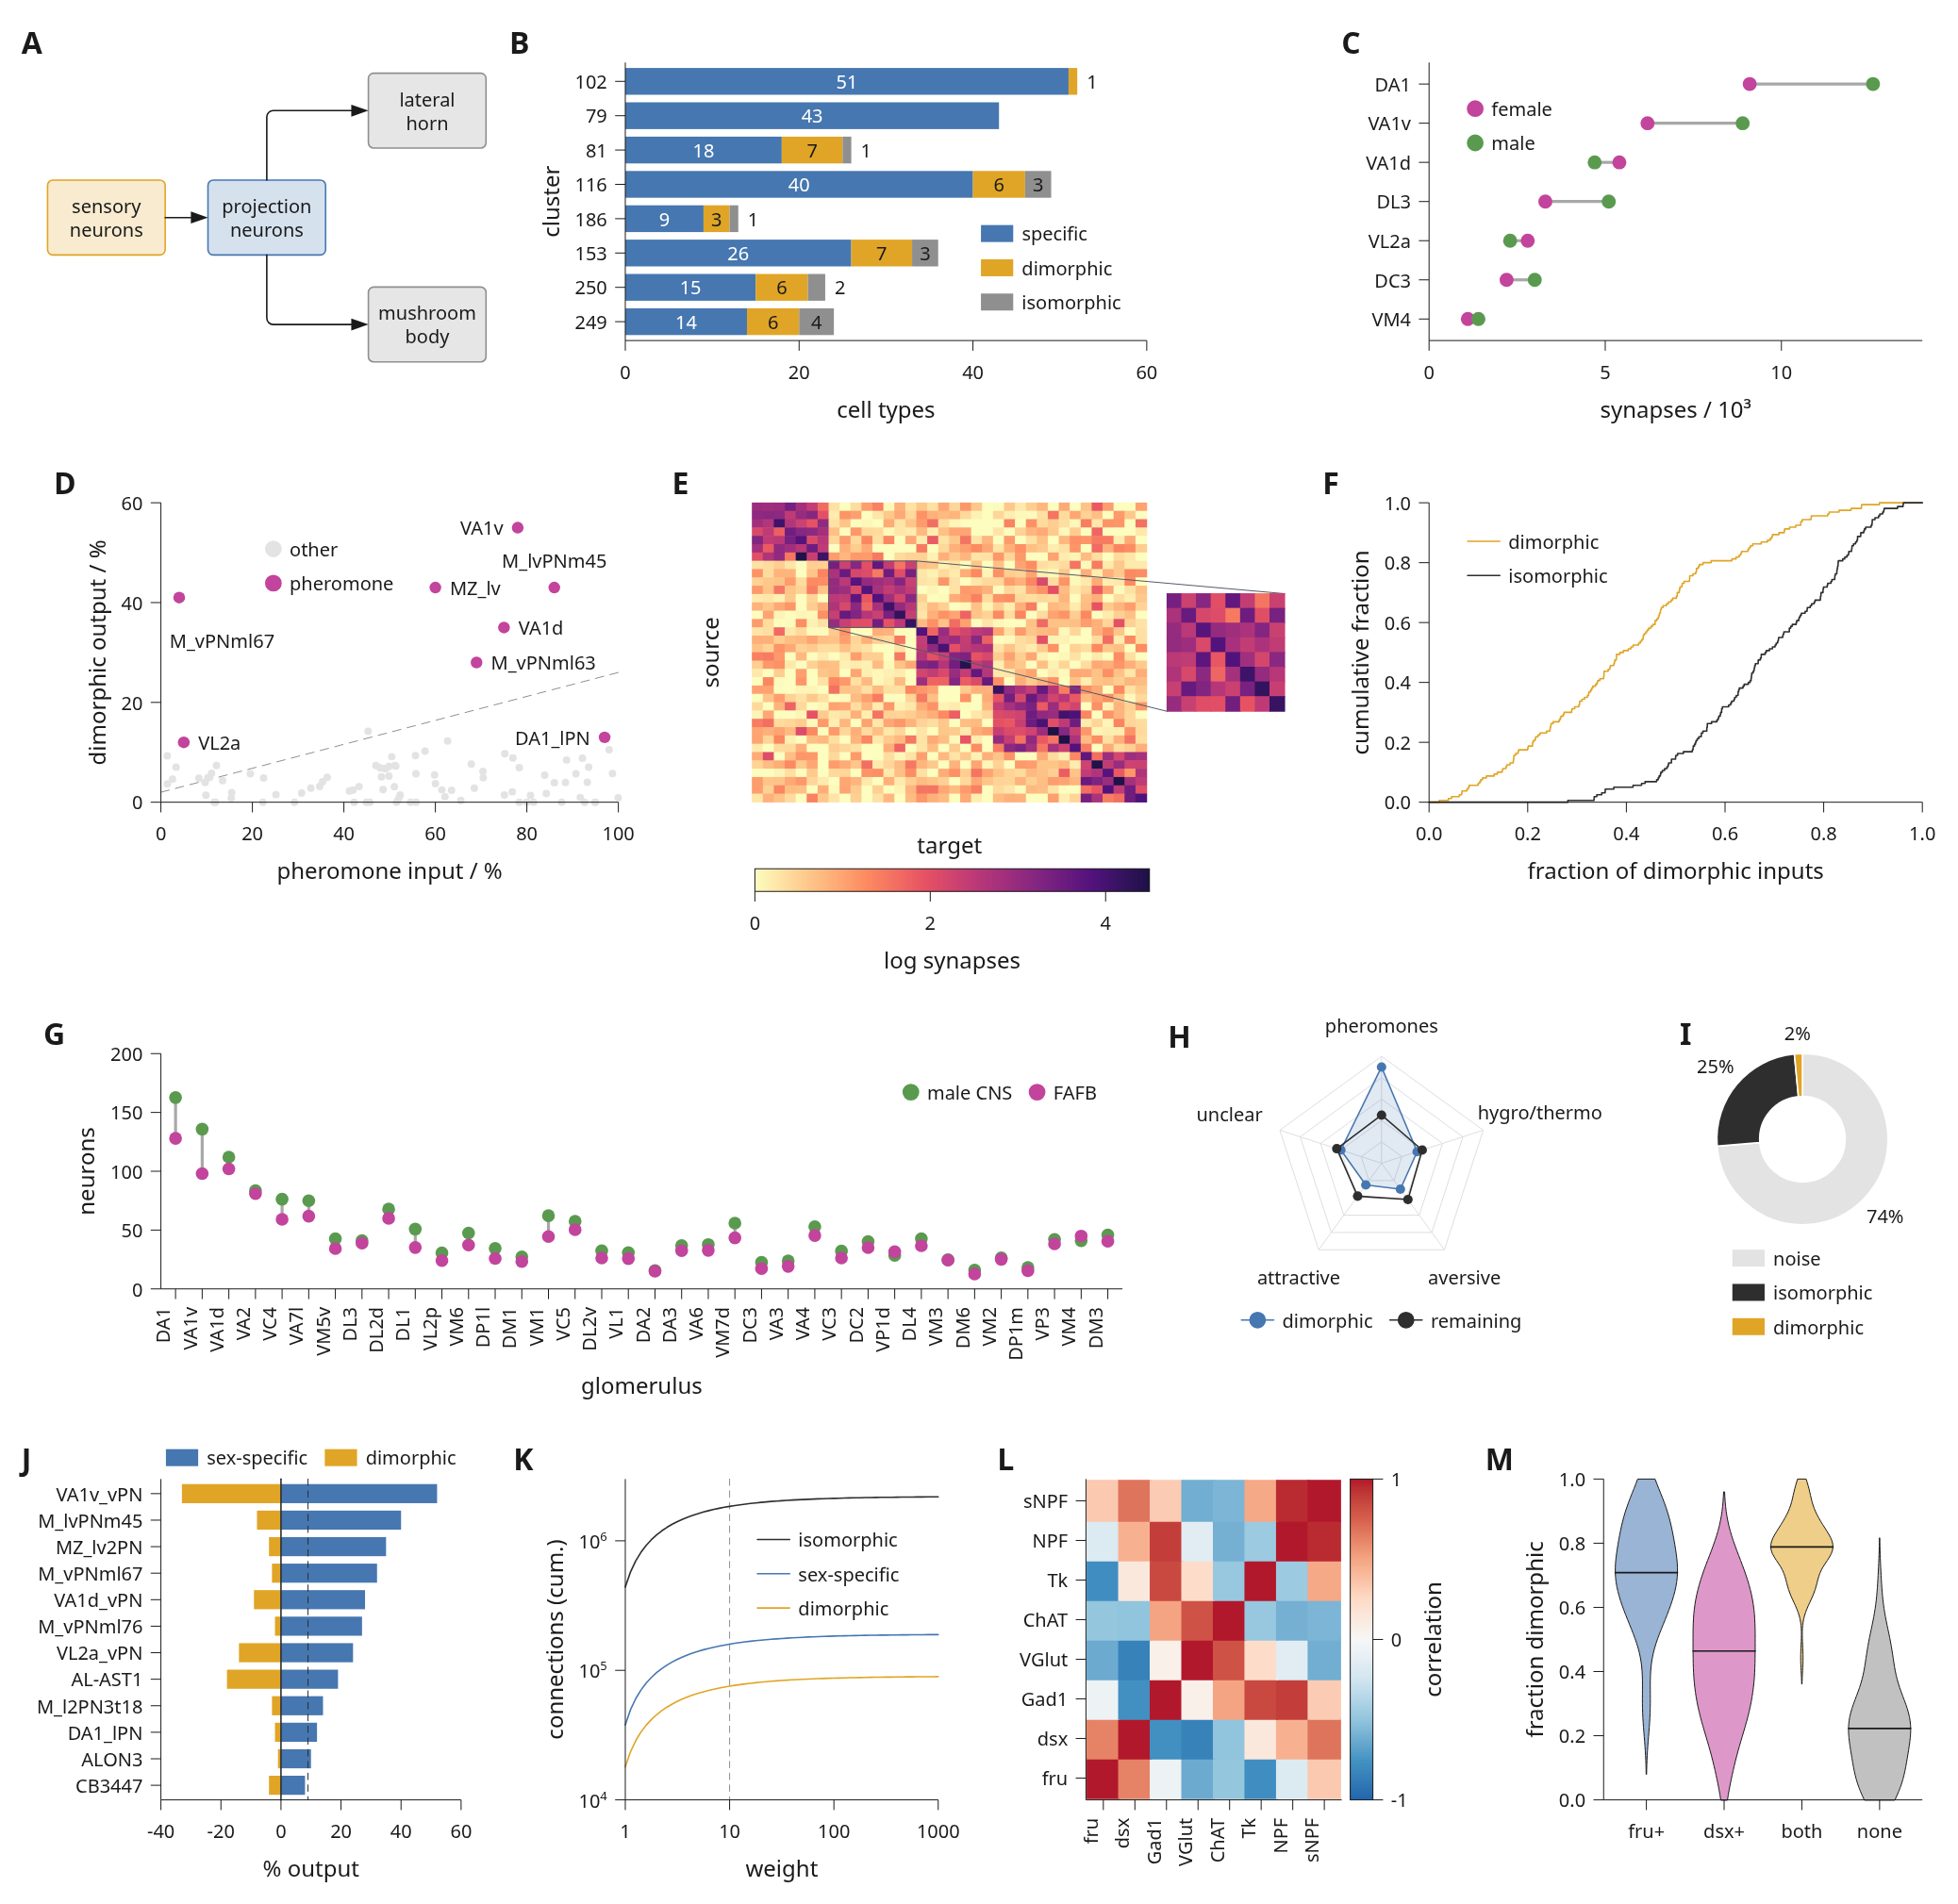
The figure above is examples/dense_figure.py.
All data are simulated. It compiles to SVG, PDF and PNG, and prints the lint
report for the page.
What each panel uses
| Panel | Content | Calls |
|---|---|---|
| a | Circuit schematic | composition(), module(), link(route='orthogonal'); see diagrams |
| b | Stacked horizontal bars with counts | bars(stacked=True, orient='h', labels=True); see bar value labels |
| c | Two groups per category | dumbbell(); see dumbbells |
| d | Scatter with named points | scatter(), label_points(); see labelled points and label placement |
| e | Heatmap, colour bar and zoom inset | matrix(), colorbar(), inset(zoom=...); see heatmaps |
| f | Cumulative distributions | ecdf(); see cumulative distributions |
| g | Dot plot over 36 categories | dumbbell() with rotated tick labels |
| h | Radar chart | polar().radar_grid(), radar(); see radar charts |
| i | Donut | polar(hole=...), pie(); see pie and donut charts |
| j | Diverging bars | two bars(orient='h') layers and vline(0) |
| k | Cumulative counts on log axes | line() with x=i.log(...), y=i.log(...) |
| l | Correlation matrix | matrix(center=0) with a diverging ramp |
| m | Violins | violin(); see violins |
The page grid
The document has 12 columns and four rows. Each panel spans a number of
columns; row heights come from the tallest plot in the row. The example sets
share_plot_margins=True, so data edges line up along shared grid lines while
each row keeps its own plot height. Panel letters are added by .letters()
in the order the panels are added.
import inklet as i

style = i.preset('scientific.cell')
blue, amber, magenta, grey, green, ink = style.theme.palette

types = ['DA1', 'VA1v', 'VA1d', 'DL3']
pairs = i.plot_spec(height=26, x=(0, 14), y=types[::-1])
pairs.dumbbell(types, [[9.1, 6.2, 5.4, 3.3], [12.6, 8.9, 4.7, 5.1]], orient='h',
               name=['female', 'male'], color=[magenta, green])
pairs.axes(x='synapses / 10³')
pairs.legend()

samples = [k / 40 for k in range(41)]
cumulative = i.plot_spec(height=26, x=(0, 1), y=(0, 1))
cumulative.ecdf([s ** 2 for s in samples], name='dimorphic', stroke=amber)
cumulative.ecdf(samples, name='isomorphic', stroke=ink)
cumulative.axes(x='fraction of inputs', y='cumulative fraction')
cumulative.legend()

points = [(78, 55), (60, 43), (86, 43), (5, 12)]
named = i.plot_spec(height=26, x=(0, 100), y=(0, 60))
named.scatter(points, size=1.1, color=magenta)
named.label_points(points, ['VA1v', 'MZ_lv', 'M_lvPNm45', 'VL2a'])
named.axes(x='pheromone input / %', y='output / %')

doc = style.document(columns=12).letters()
doc.add('pairs', pairs, row=0, column=0, colspan=4)
doc.add('cumulative', cumulative, row=0, column=4, colspan=4)
doc.add('named', named, row=0, column=8, colspan=4)
figure = doc.compile()
figure.save('dense-row.svg', 'dense-row.pdf')
assert not [d for d in figure.lint() if d.severity == 'error'], figure.report()
Widths are physical: at 183 mm with a 2 mm margin and 3.5 mm gaps, a 4-column span is about 57 mm. Axis labels, tick labels and legends are measured with the embedded font before each data region is placed, so panels in the same row keep aligned data areas even when their tick labels differ in length.
What the preset changes
scientific.cell uses 6 pt body text, 5 pt tick labels, 8 pt bold panel
letters, 0.4 pt axes and 0.25 pt hairlines. Legends without an explicit side
go inside the data area, in space that no mark occupies. The lint thresholds
follow the preset: a 5 pt minimum text size and a 0.25 pt minimum stroke. The
full table is in presets: dense pages.
Run the complete example
From a repository checkout:
python examples/dense_figure.py
It writes out/dense-figure/figure.svg, .pdf and .png, and prints the
diagnostics. See export and review for
what the findings mean, and panel layout for spans, nested
subfigures and fixed artwork.