

On this page
More example recipes
Browse the figure gallery for previews. For step-by-step instructions, start with your first figure or a figure from CSV. This page lists standalone scripts.
These figures link to executable source in the repository. Commands below run
from a checkout with Inklet installed. Review bundles need the
preview dependencies; add --vectors-only
where supported to save only SVG/PDF.
Related studies and variants
The main figure gallery keeps one card for each distinct goal. These source routes remain available here as focused variants and recorded studies; they are grouped to keep the page useful as a source index.
Layout and rendering studies: save and restore layouts, local layout editor, reusable plot compositions, dense plot engine review, rendering and nested layout, render jobs, and the twenty-panel stress test.
Microscopy variants: fluorescence channels, slab projections and oblique sections.
Anatomy variants: label an open anatomy model and the community connectivity plate.
3D scene studies: scene templates, scene annotations, scene paths, label movement revision, label crossing study, and the figure planner study.
Showcase and configuration variants: architectural sketch, direct plot collection, and presets.
A complete live document
The v2.5 example combines nested grids, measured architecture modules, plots, publication defaults and live data.
inklet build examples/v25_document.py --output out/v25 --name document
Start here when adapting Inklet for your own multi-panel figure. The smaller v2 example focuses on datasets and shared scales.
Twenty-panel stress test
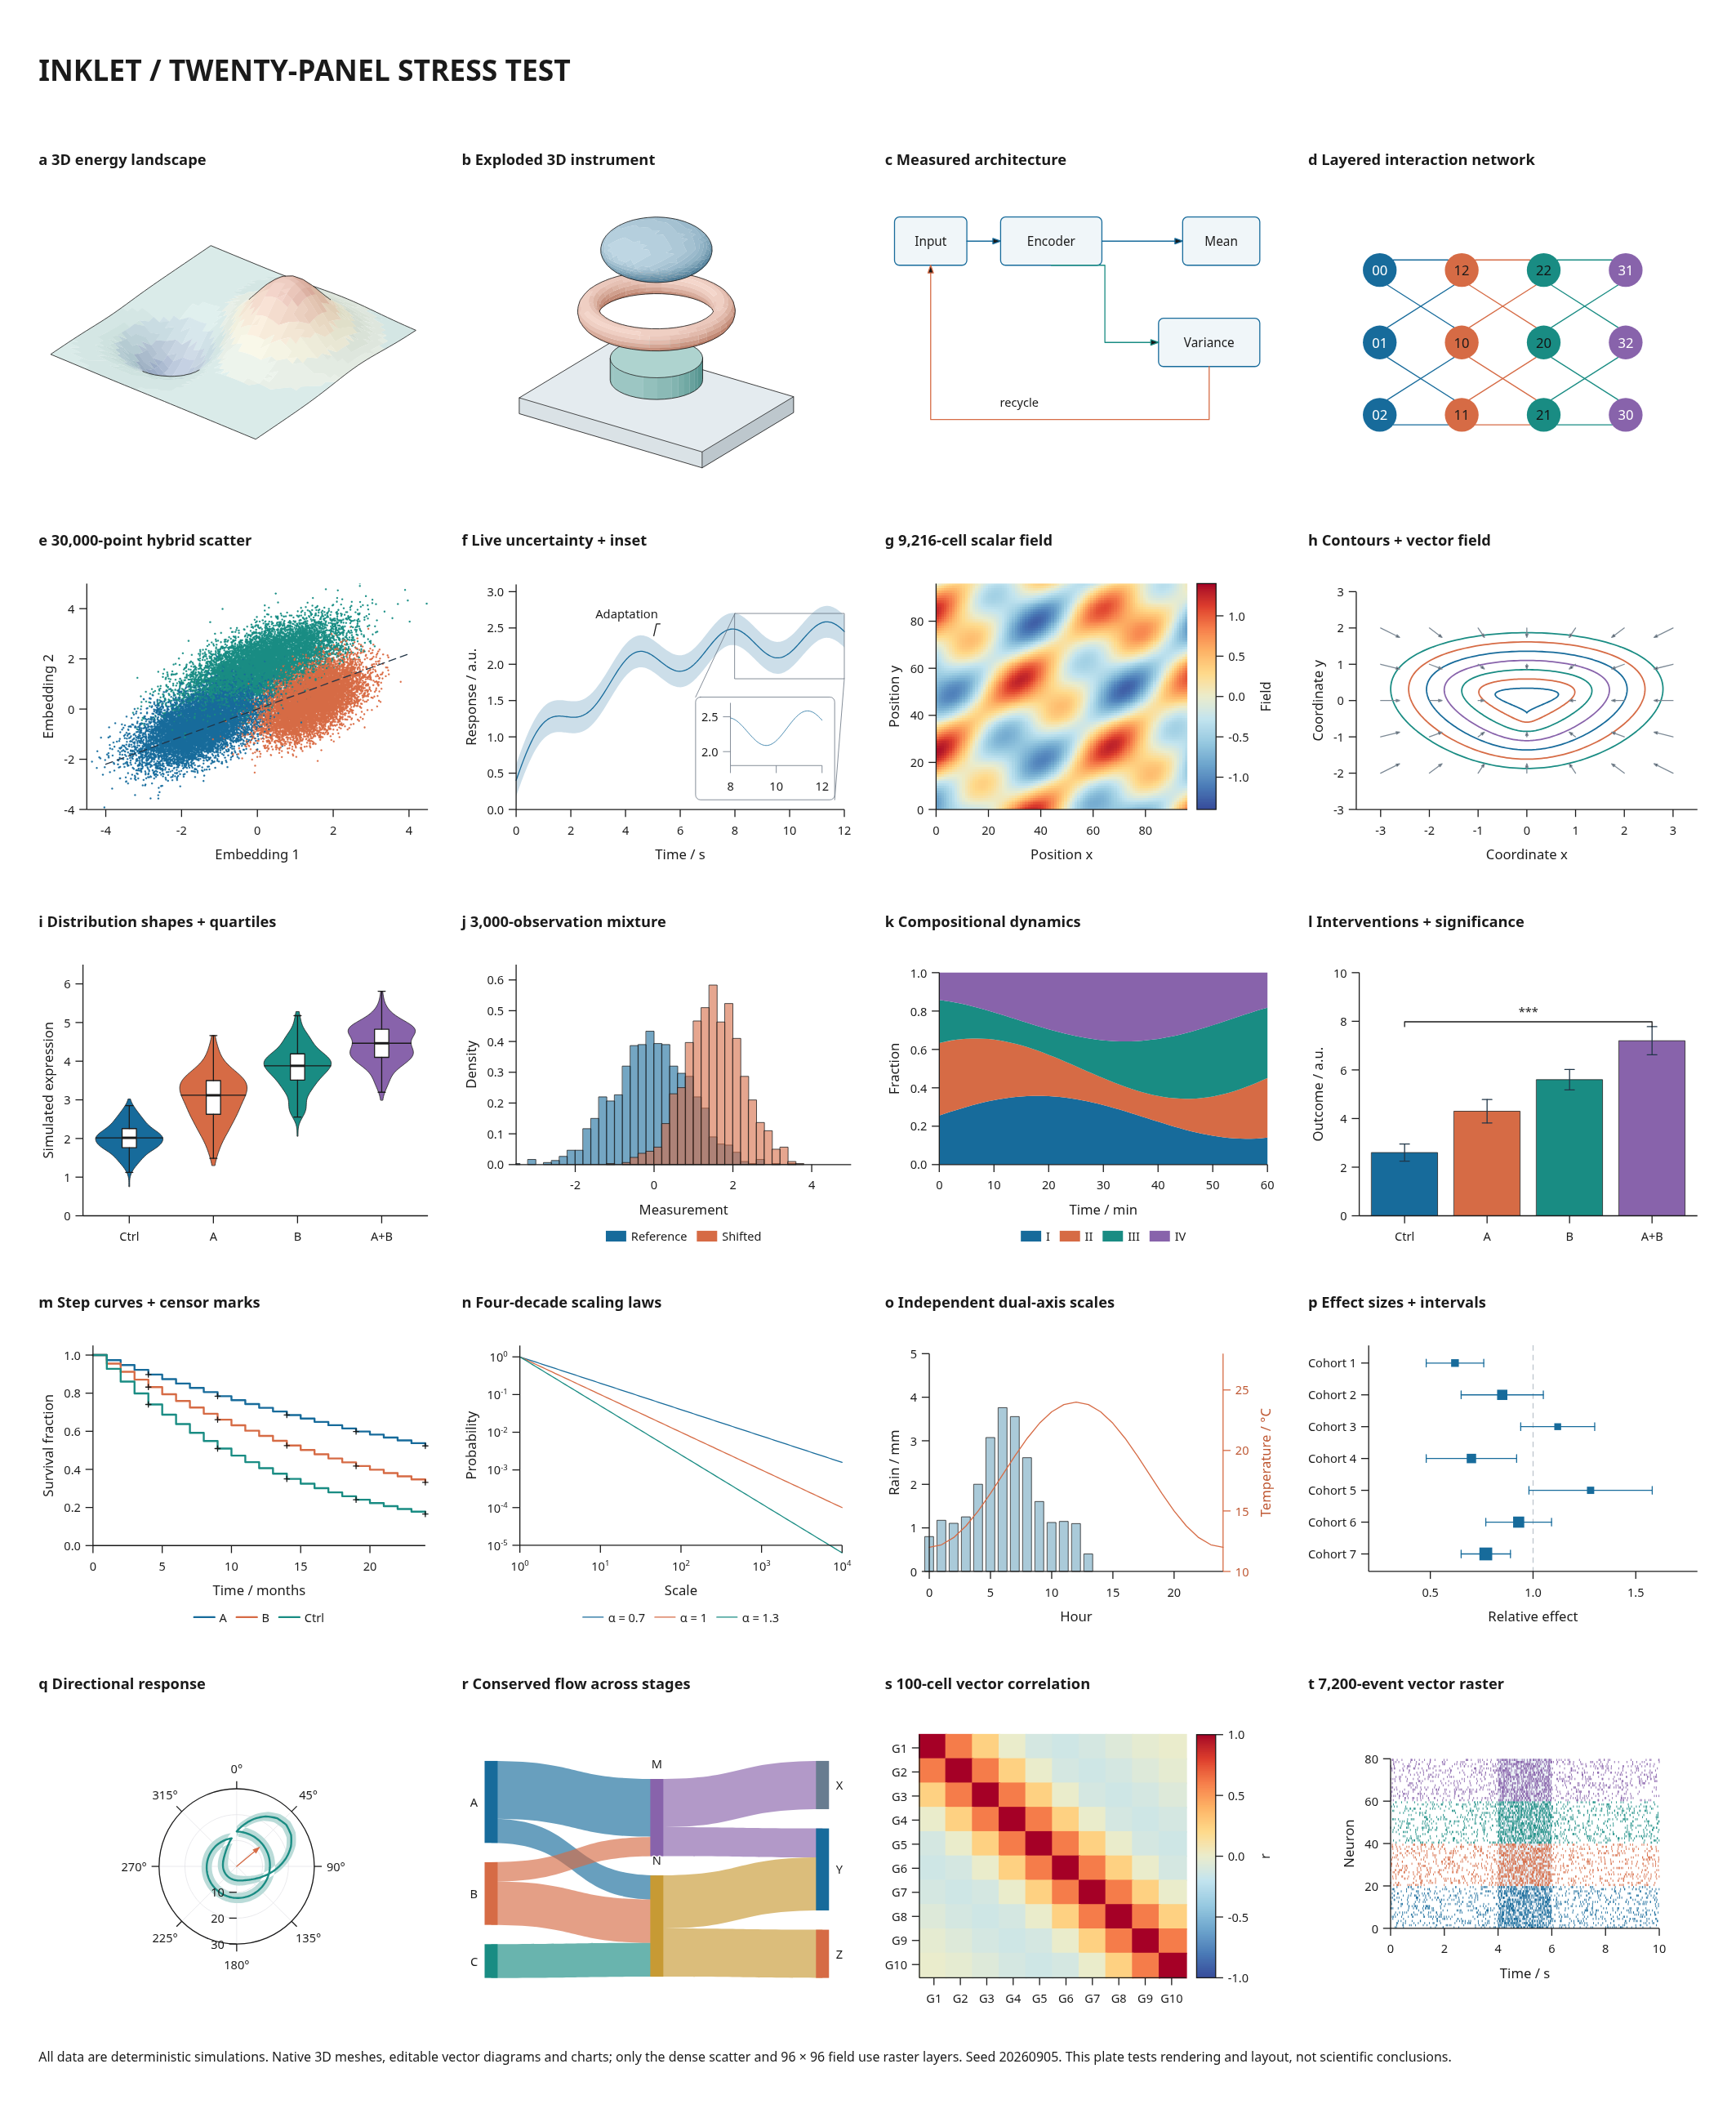
Native 3D, a measured architecture, network, dense scatter, statistical charts, polar response, Sankey flow and vector events share one page. The data are simulated and the meshes are generated locally.
python tools/stress20.py
Source · Workload, checks and findings
This command also exercises edits, cached compilation, provenance, resizing and independent SVG/PDF rendering. It takes longer than the small examples.
Direct drawing examples
| Figure | Source | Run |
|---|---|---|
| Plot collection | gallery.py | python examples/gallery.py |
| Methods flow | showcase_process.py | python figures/showcase_process.py |
| Time series and heatmap | showcase_season.py | python figures/showcase_season.py |
| Labelled 3D part | showcase_part.py | python figures/showcase_part.py |
| Polar response | polar.py | python examples/polar.py |
These use the direct API and may save next to their source scripts. Their output paths are defined in the scripts; they are not all CLI factory modules. The repository gallery lists additional figures and assets.
Scientific examples
The neural-activity example combines learning curves, a spike raster, a peri-event histogram and endpoint statistics. All observations are simulated from fixed seeds.
python figures/neural_activity.py
The structure figure draws the EGFR kinase from PDB 1M17 beside explicitly simulated assay data. See the third-party notices for the structure data and meshes.
Plot collection
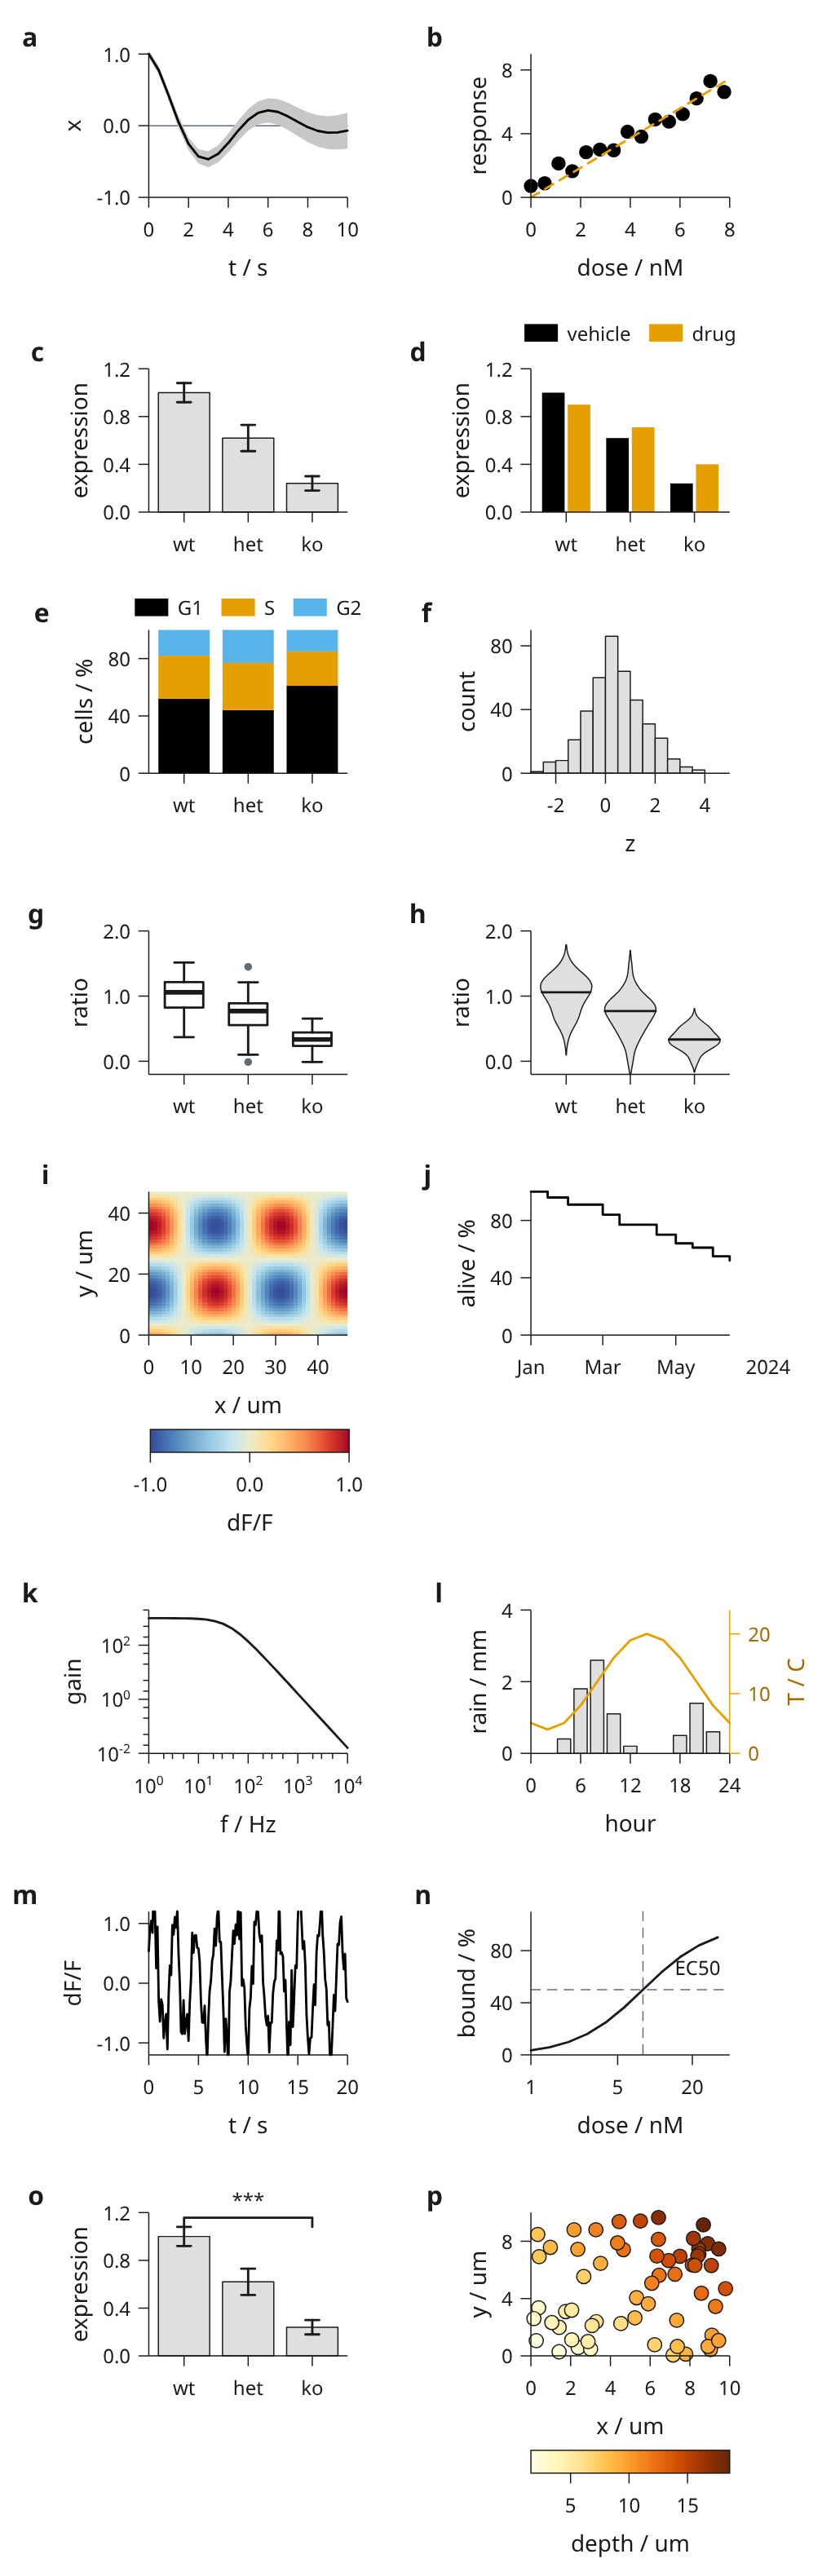
Run python examples/gallery.py from a checkout. Source.
Methods flow
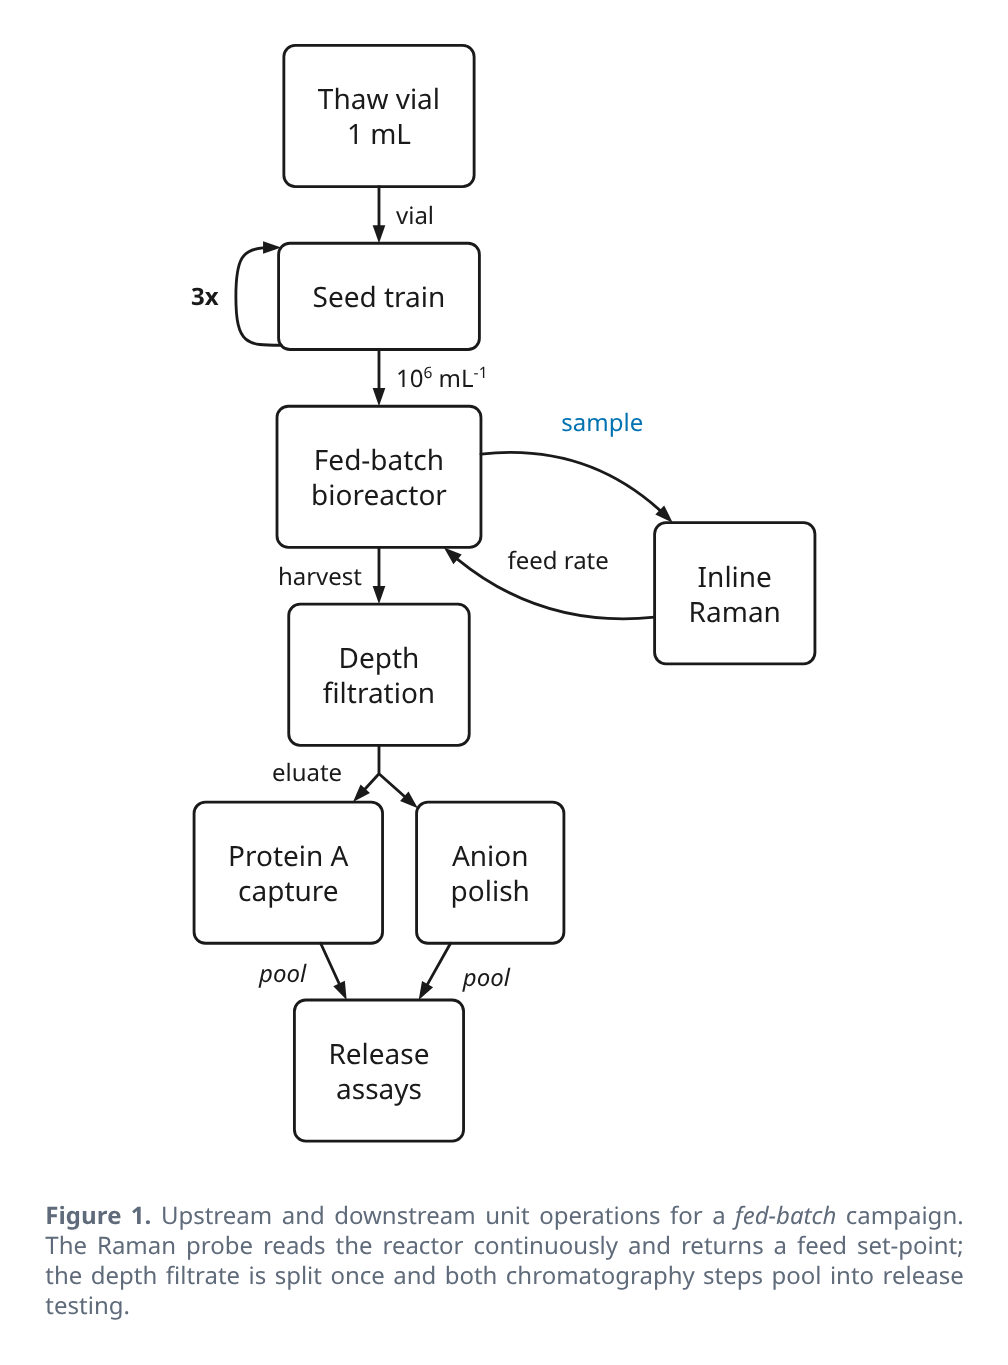
Run python figures/showcase_process.py. Source.
Time series and heatmap
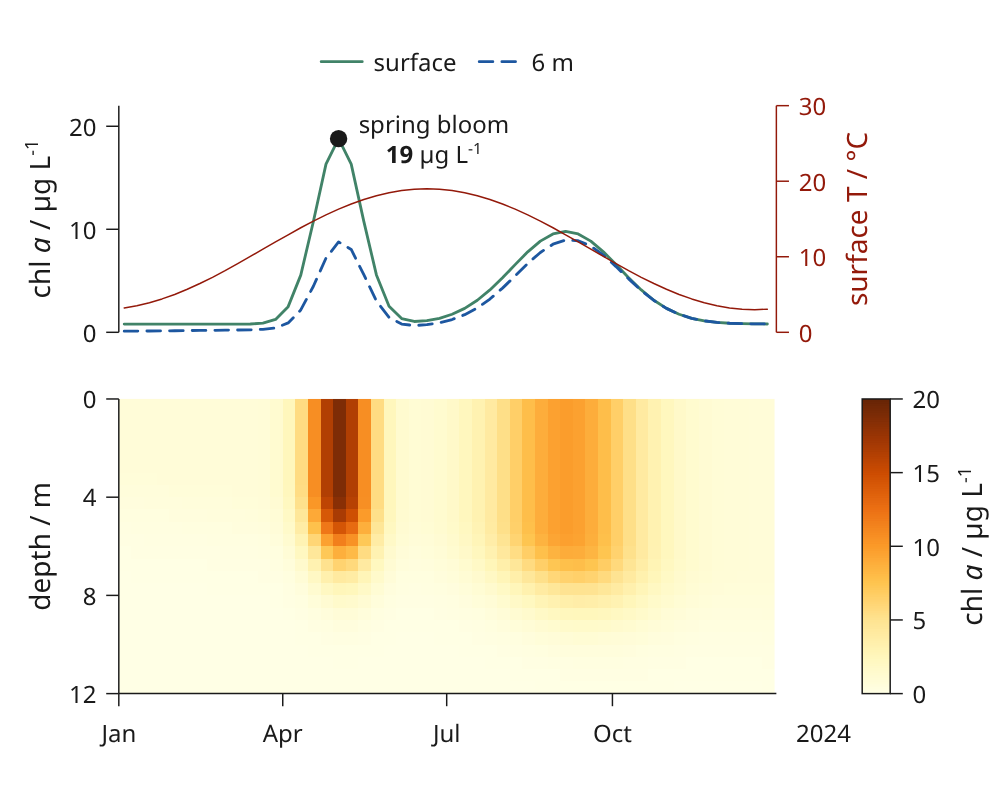
Run python figures/showcase_season.py. Source.
Labelled 3D part
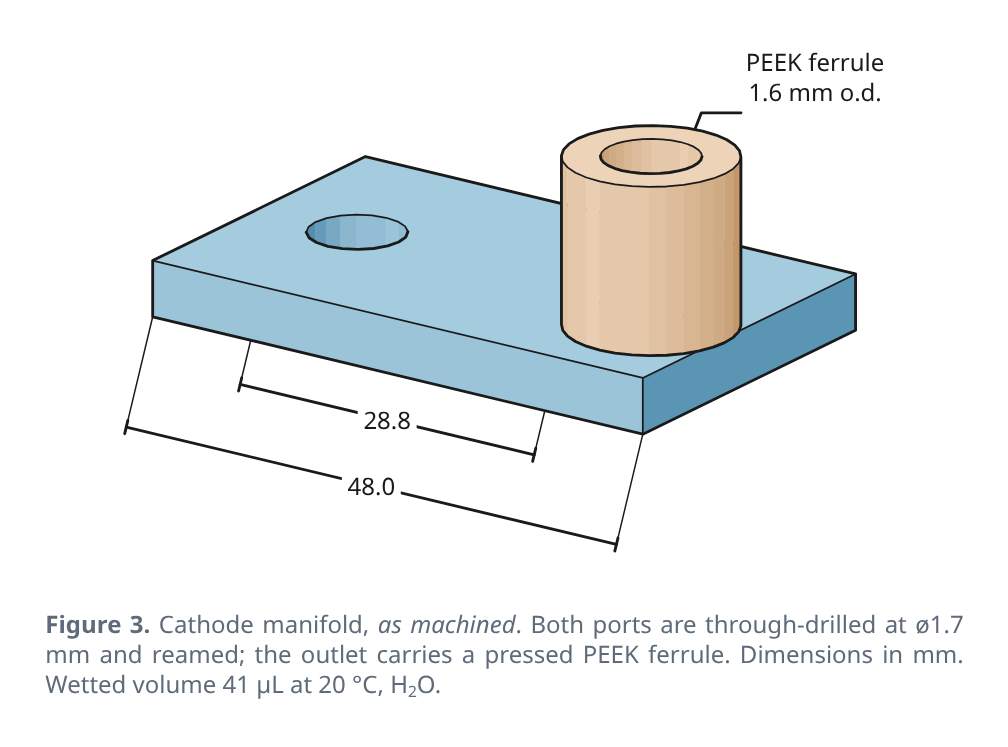
Run python figures/showcase_part.py. Source.
Polar response
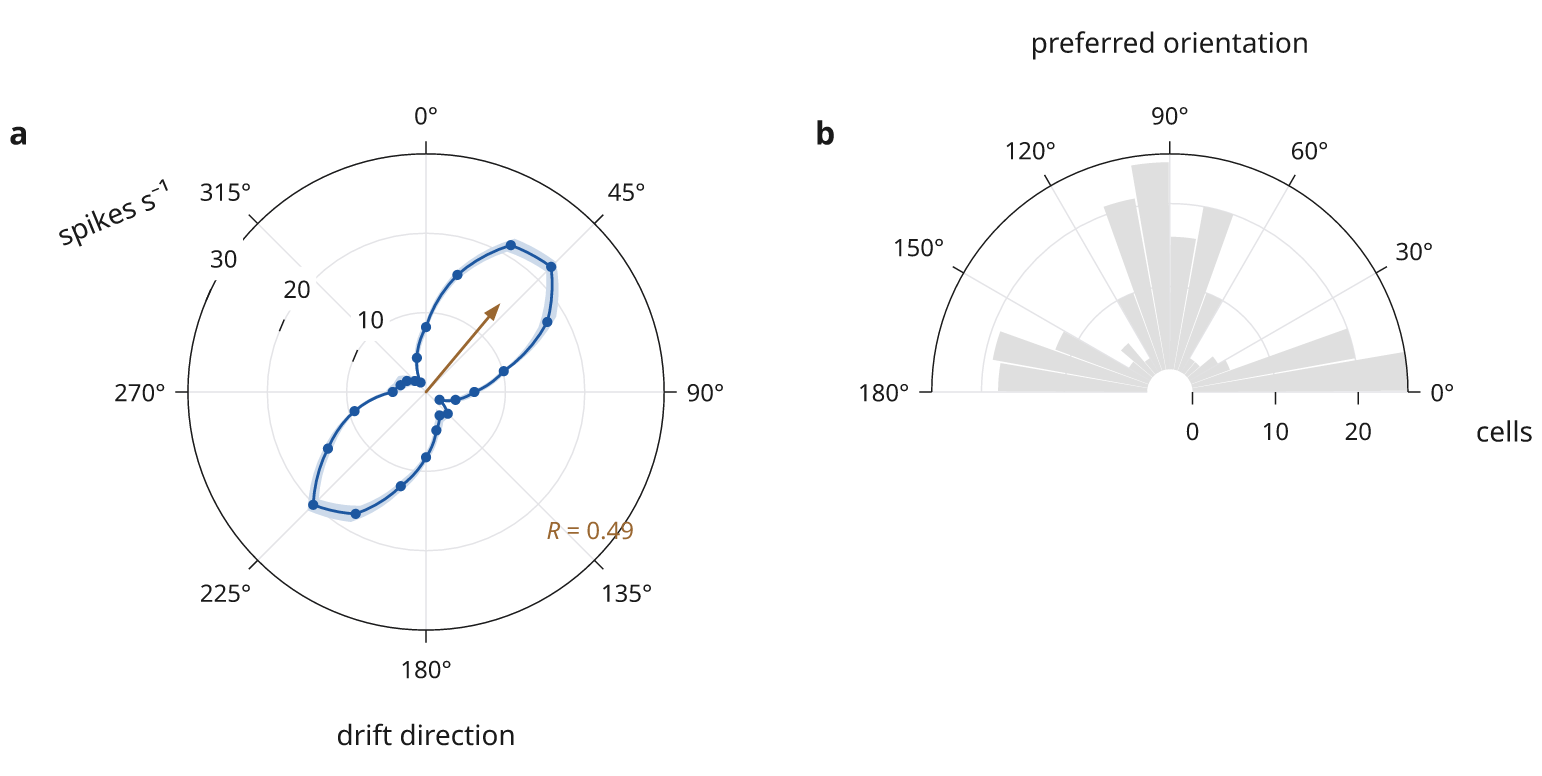
Run python examples/polar.py. Source.