

On this page
Genomics and ternary plots
Three specialist plots: the Manhattan plot of a genome-wide association study, the MA plot of a differential-expression test, and the ternary plot of three-part compositions. For the volcano plot, see Lines and points.
Manhattan plots
inklet.manhattan(chromosome, position, p) returns a panel with its axes,
ready for more layers or for fig.add. Chromosomes are laid end to end in
natural order (1, 2, ..., 10, ..., X, Y, MT; a chr prefix is fine), or
in order=. Points alternate between two shades per chromosome, and
bands=True also shades every other chromosome's span.
threshold draws the genome-wide significance line (5e-8, red) and
suggestive a grey one (1e-5); either can be None. With labels=, the
top lead hits are named: a lead hit is the variant below threshold with the
smallest p within window base pairs (1 Mb). highlight= draws chosen
variants in red. For a million variants, pass raster=True to rasterise
the points.
inklet.plot.manhattan_layout returns the same positions, chromosome spans
and lead hits without drawing anything.
import inklet as i
import math
import random

rng = random.Random(11)
peaks = {'2': (60e6, 14), '6': (32e6, 22), '11': (100e6, 9), '16': (50e6, 10.5)}
chrom, pos, pvalues, ids = [], [], [], []
for number in list(range(1, 23)) + ['X']:
    c = str(number)
    length = 155e6 if c == 'X' else 250e6 * (1 - 0.035 * (int(c) - 1))
    for k in range(int(length / 2e6)):
        x = rng.uniform(0, length)
        y = rng.expovariate(1.0)
        if c in peaks and abs(x - peaks[c][0]) < 3e6:
            y = max(y, peaks[c][1] * math.exp(-((x - peaks[c][0]) / 1e6) ** 2))
        chrom.append('chr' + c); pos.append(x); pvalues.append(10 ** -y)
        ids.append(f'rs{rng.randint(1000, 999999)}')
    if c in peaks:
        for _ in range(30):
            x = peaks[c][0] + rng.gauss(0, 0.6e6)
            y = peaks[c][1] * math.exp(-((x - peaks[c][0]) / 1e6) ** 2) + rng.uniform(0, 1)
            chrom.append('chr' + c); pos.append(x); pvalues.append(10 ** -y)
            ids.append(f'rs{rng.randint(1000, 999999)}')
gwas = i.manhattan(chrom, pos, pvalues, labels=ids, top=4, width=150, height=40)
fig = i.figure(width=170)
fig.add(gwas.build())
fig.save('manhattan.svg', 'manhattan.pdf')
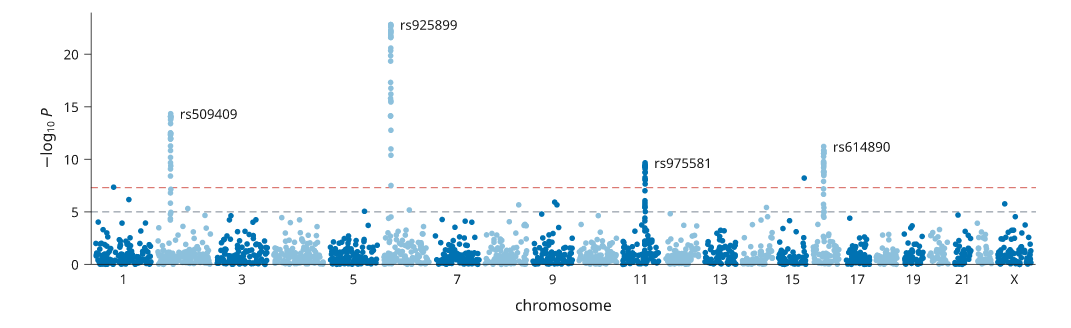
Simulated association results with four loci above genome-wide significance.
MA plots
Panel.ma(mean, fold, p) plots each feature's log2 fold change against its
mean expression. The mean is drawn as log2(mean + 1) unless log=False.
Points are classified as volcano classifies them: "up" and "down" need p
below p_threshold and |fold| of at least fold_threshold. Without p,
fold change alone decides. Non-significant points are pale grey and drawn first,
and a hairline marks a fold change of 0. labels= names the top most
significant points.
import inklet as i
import math
import random

rng = random.Random(4)
mean = [2 ** rng.uniform(0, 15) for _ in range(1500)]
fold = [rng.gauss(0, 0.5) + (rng.random() < 0.05) * rng.choice([-1, 1]) * rng.uniform(1, 4)
        for _ in range(1500)]
padj = [min(1.0, 2 * math.exp(-abs(f) * 4 * rng.uniform(0.2, 1.5))) for f in fold]
genes = [f'Gene{k}' for k in range(1500)]
ma = i.panel(55, 40, x=(0, 16), y=(-6, 6))
ma.ma(mean, fold, padj, labels=genes, top=5, name=['down', None, 'up'])
ma.axes(x='log_{2} mean expression', y='log_{2} fold change').legend(side='right')
fig = i.figure(width=89)
fig.add(ma.build())
fig.save('ma.svg', 'ma.pdf')
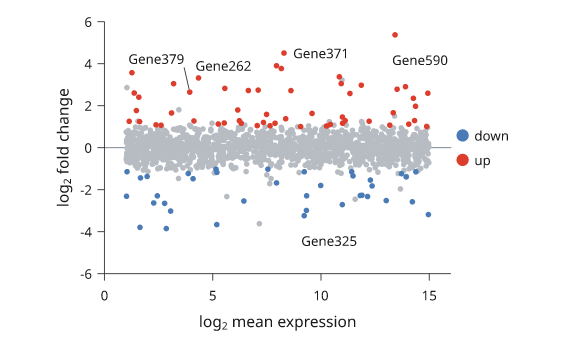
Simulated expression. About one gene in twenty is differentially expressed.
Ternary plots
Panel.ternary(points) draws three-part compositions in an equilateral
triangle fitted into the plot area. Each (a, b, c) point is normalised to
fractions of its sum. The first call draws the triangle with labels[0] at
the top vertex, labels[1] bottom left and labels[2] bottom right, a
pale grid and tick labels as parts of total (100). Later calls add points to
the same triangle. The points are an ordinary scatter, so name=,
color=, size= and ramps work, and legend() names the series.
import inklet as i
import random

rng = random.Random(2)
upland = [(rng.uniform(5, 30), rng.uniform(40, 80), rng.uniform(10, 30)) for _ in range(30)]
valley = [(rng.uniform(30, 60), rng.uniform(5, 25), rng.uniform(25, 50)) for _ in range(30)]
soil = i.panel(50, 45)
soil.ternary(upland, labels=('clay', 'sand', 'silt'), name='upland')
soil.ternary(valley, name='valley').legend(side='right')
fig = i.figure(width=80)
fig.add(soil.build())
fig.save('ternary.svg', 'ternary.pdf')
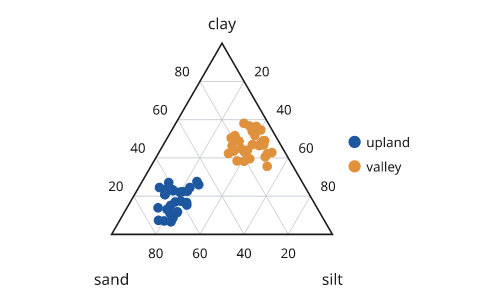
Illustrative soil samples. Upland soils are sandy and valley soils richer in clay and silt.
Next steps
Compare plot types, see volcano plots, or arrange several panels. For exact options, see the API.