

On this page
Linked category panels
Experimental: the API may change.
Split a line, bar or scatter view into ordered category panels while keeping
selection linked by row ID. FacetView was introduced in the 4.0.0.dev1 preview
and is available under inklet.experimental.browser.
Open the interactive figure · Complete Python recipe
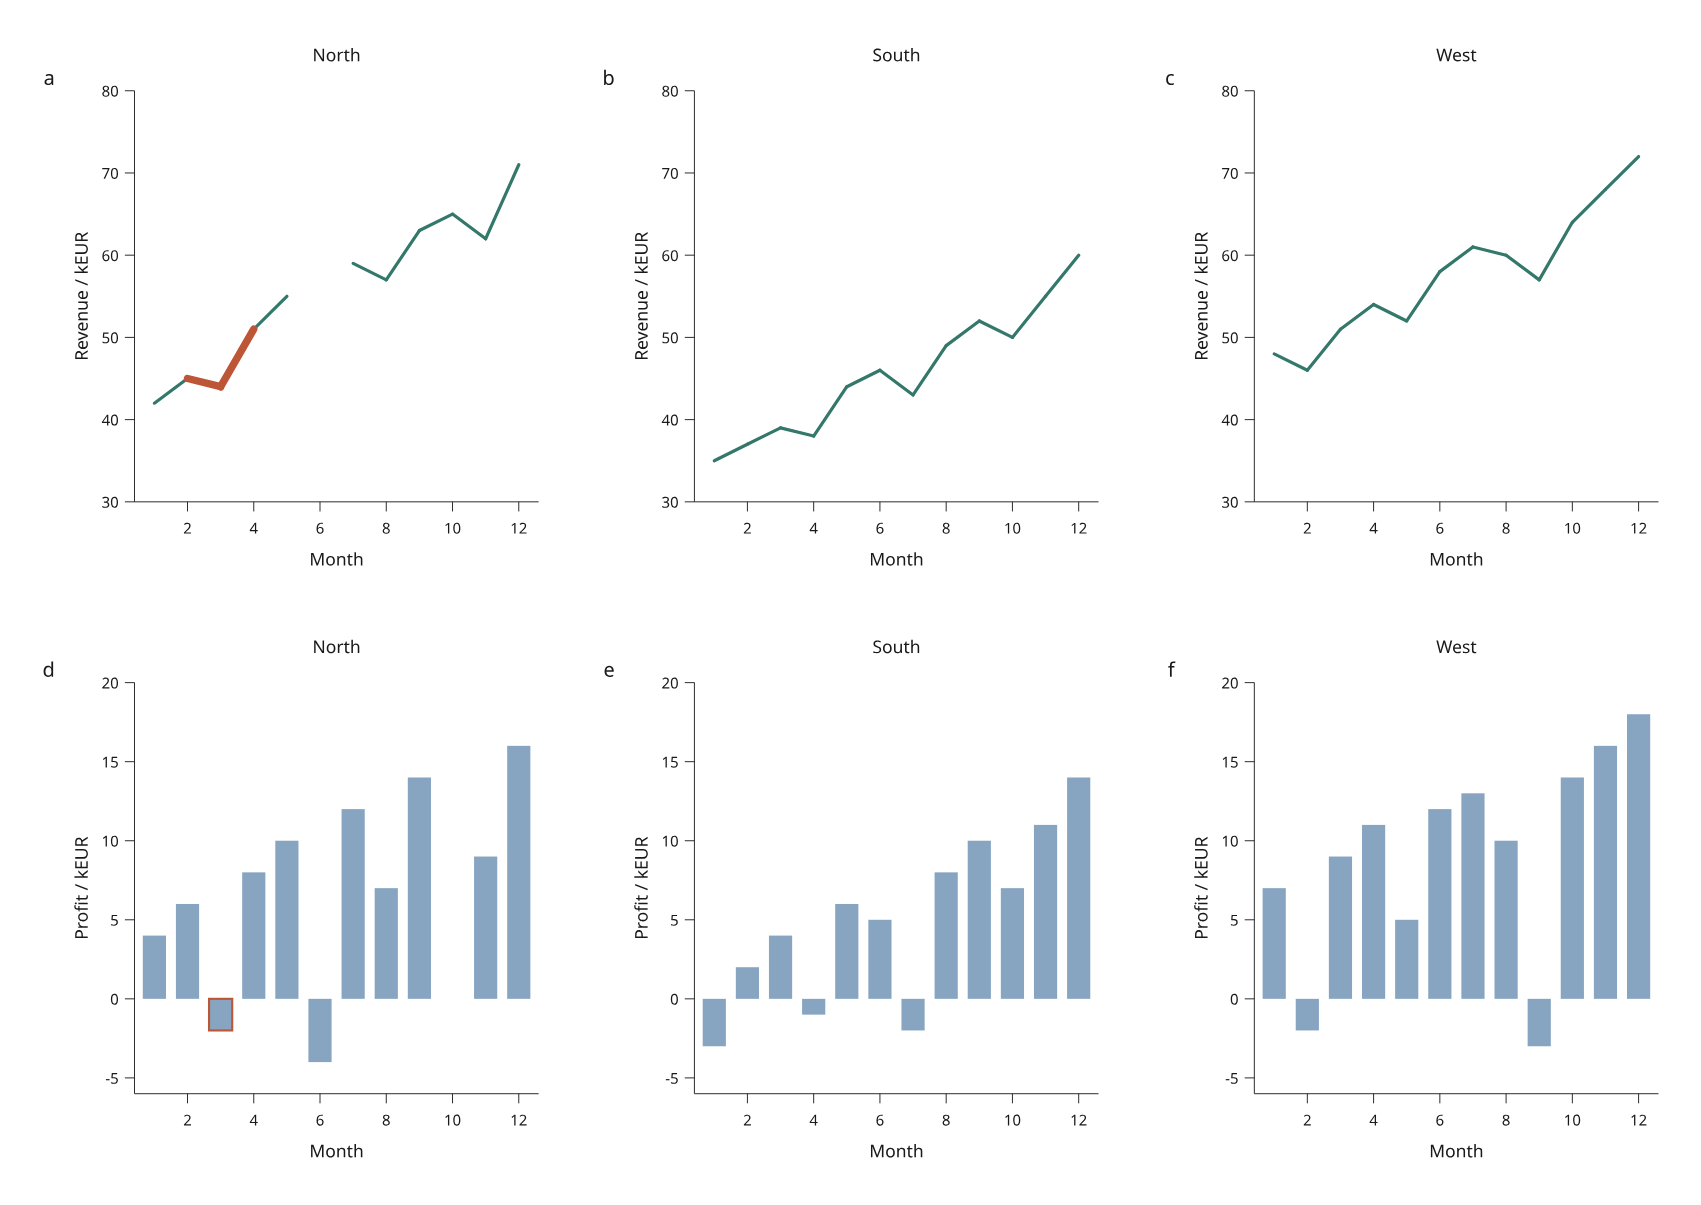
The recipe uses 36 original simulated monthly rows, with three invented business categories. The first row of panels shows revenue; the second shows signed profit. Every category uses the same revenue domain and the same profit domain; month positions align across both rows of panels. North has missing revenue in June and zero profit in October. These are illustrative values, not company accounts. Category labels identify the panels; the explanation stays outside the artwork.
Explore the figure
- Click North's negative March profit bar. The incident revenue segments in
North's panel highlight the same
north-03row. Other categories stay separate. - Search for
North. The South and West panels retain their axes and category labels, so filtering does not move the remaining panels. Clear the search. - Switch between SVG, canvas and hybrid display, then download vector SVG. All three use the same compiled geometry and row selection.
- Expand Data revision and apply North and South only. West's panels remain present and empty. If you selected a West row, the default missing-ID policy rejects its removal; choose Drop removed IDs to transfer the view and inspect the report. Retained revenue and profit values do not change.
Selecting a line chooses an endpoint row. A valid row with no neighboring valid observation has no line segment but remains available in its bar panel or table. The linked plot guide documents picking and filtering details.
Define categories explicitly
from inklet.experimental.browser import BrowserFigure, FacetView, LineView
from inklet.selection import KeyedTable

table = KeyedTable("observations", {
    "id": ["n1", "s1", "n2", "s2"],
    "region": ["North", "South", "North", "South"],
    "month": [1, 1, 2, 2],
    "revenue": [42, 35, 45, 37],
})
figure = BrowserFigure(table, [
    FacetView(
        LineView("revenue", "month", "revenue", (1, 12), (30, 80),
                 x_label="Month", y_label="Revenue / kEUR"),
        column="region",
        values=("North", "South", "West"),
    ),
], width=240, columns=3)
values supplies the exact category order. Each value must be a unique nonempty
string. Optional labels=(...) provides display labels in the same order and
with the same length; omitting labels displays the values themselves. The
underlying category column contains strings or None. Category labels are
measured with the figure's text layout; they are included in vector export.
Empty categories retain their panels. Null categories and strings absent from
values remain in the global keyed table but produce no marks in that facet
group. They can still be selected through the table or another view. Inspect
figure.payload()["facet_groups"]: each entry reports its name, column,
ordered values and unassigned_ids. These rows are not silently reassigned to
an automatic “Other” category.
The browser lists unassigned source IDs under Rows outside facet categories. This diagnostic updates when switching data revisions. It describes the source table, independently of the current visibility filter.
Facet figures share measured plot margins across the whole grid, so equal
domains also have equal physical scales across their panels. Empty panels
reserve the same space. Ordinary documents can opt into the same rule with
document(..., share_plot_margins='all').
document(..., share_plot_margins=True) or
subfigure(..., share_plot_margins=True) aligns plots without reserving
every plot's furniture on every other plot. Left and right furniture is shared
along vertical grid lines: stacked plots whose cells start on the same grid
line reserve the largest left furniture among them, and stacked plots whose
cells end on the same grid line reserve the largest right furniture among them,
so their data edges line up. Plots are stacked when their rows touch. A long label in one column does not narrow plots that share
neither of its grid lines. Top and bottom furniture is shared along each
row, and every row adds its own furniture to the tallest natural data region;
a legend or colorbar under one row adds no space under the others. A fixed
page height keeps these rows and gives extra space to plot rows in proportion
to their data heights. Fixed artwork retains its authored size. This option defaults to False.
The wrapped view supplies fixed domains, axis labels, color and mark settings. Line adjacency follows source order within each category, so interleaving North and South rows does not join their lines or break either series. Null x/y pairs break a category's line. Filtering removes segments incident to hidden rows; it never reconnects surviving observations across a removed row. Inklet does not sort, aggregate or interpolate the table.
The statistical preview also supports faceted ECDF and interval views. ECDF populations are calculated per category and remain fixed during filtering; supplied interval bounds are not recalculated.
BrowserFigure accepts one to four view definitions, expanding to at most
twelve panels. Plain views and facets can share a figure. The default layout
uses at most two columns; set columns=1 through 4 explicitly to control the
grid. Facets wrap ScatterView, LineView, BarView, ECDFView or IntervalView; geographic region
facets, nested facets and automatic category discovery are outside this preview.
Save, replace and reconstruct
python examples/v4/faceted_operations.py --output out/v4-facets

# Reopen a view saved while all three regions were active.
python examples/v4/faceted_operations.py --state /path/to/view.json \
  --output out/v4-restored

# Reopen a view saved after switching to North and South only.
python examples/v4/faceted_operations.py --without-west \
  --state /path/to/revised-view.json --output out/v4-restored
The script writes an offline index.html, vector figure.svg and view.json.
The HTML opens with the saved selection, filter and page viewport applied;
the SVG reconstructs the same state in Python. Saved-state loading requires
the exact data and measured scene revision.
Use replace_data() or an embedded RevisionOption to transfer selections to
revised data explicitly. Facet definitions are retained, including categories
that lose all their rows. The data replacement guide
explains removed-ID handling and viewport policies. This example embeds both
cohorts, requires no external requests and credits its simulated data in the
page footer.
SeriesView also supports facets,
with each entity's complete sample sequence contained in its category panel.