

On this page
Matrices and heatmaps
A matrix assigns a colour to each cell. Share the mapping with its colour key, and state the units. A calibrated image or contour field has additional coordinate semantics; see the scientific report and contour guide for the experimental linked workflows.
All values below are illustrative. Each Python block is a complete example
using core Inklet. PNG previews additionally use the render extra; PDF export
of raster matrices needs Pillow (images or render).
Heatmaps
A colour key describes the same mapping as the matrix.
colorbar() reuses the matrix ramp and scale. Pass explicit row coordinates
to associate each row with its y category. The first category is at the bottom;
the next section shows a top-first display. Missing cells use an explicit colour.
colorbar(label=) names the bar along its length, turned to read upward beside
a vertical bar, which is how journals set a colour bar's name; colorbar(title=)
sets the name horizontally above the bar instead.
import inklet as i
p = i.plot_spec(x=['A', 'B', 'C', 'D'], y=['Run 1', 'Run 2', 'Run 3'], height=45)
p.matrix([[2, 5, 7, 3], [4, None, 8, 5], [1, 3, 6, 9]],
         x=['A', 'B', 'C', 'D'], y=['Run 1', 'Run 2', 'Run 3'],
         ramp=i.ramp('tol-ylorbr'), scale=i.linear((0, 10)),
         missing='#e8e8e8', raster=False)
p.axes(x='Condition', y='Run')
p.colorbar(label='Value / a.u.')
doc = i.document(width=105)
doc.add('matrix', p)
doc.save('matrix.svg', 'matrix.pdf')
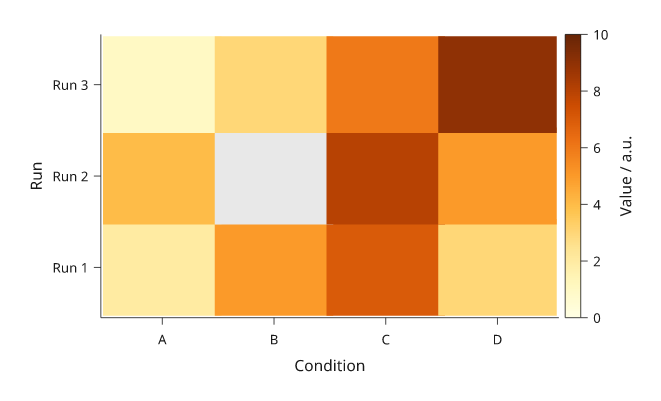
Rendered from the code above. Grey means missing, not zero.
Keep rows rectangular and supply missing= when any value is None or NaN.
The colourbar describes the numeric ramp; explain the missing-value colour in
the caption. Use the same ramp and scale for comparable panels instead of
normalizing each matrix independently.
On a panel with a matrix, an axis with no ticks (ticks=[]) or hidden ticks
(labels=False with tick_size=0) draws no spine, since the cells' edge is
already the boundary. The axis name is still drawn. Pass spine=True to keep
the line.
Row order and comparisons
With explicit y= coordinates on matrix(), rows follow those coordinates
through the panel's y scale. To put the first named row at the top, reverse the
category order on the plot scale and keep the matrix's row coordinates paired
with their values. If you reorder the values themselves, reorder their
coordinates too.
Without y= on matrix(), row zero starts at the top of the plot area and
rows divide the height evenly, independently of the y scale. This differs from
the bottom-first categorical axis. Explicit coordinates avoid a silently
mislabelled heatmap.
import inklet as i

conditions = ['A', 'B', 'C']
runs = ['Run 1', 'Run 2', 'Run 3']
values = [[1, 2, 3], [4, 5, 6], [7, 8, 9]]
shades, colour_scale = i.ramp('tol-ylorbr'), i.linear((0, 10))
doc = i.document(width=180, columns=2, gap=12,
                 share_plot_margins=True).letters()
for column, labels in enumerate((runs, runs[::-1])):
    p = i.plot_spec(x=conditions, y=labels, height=42)
    p.matrix(values, x=conditions, y=runs,
             ramp=shades, scale=colour_scale, raster=False)
    p.axes(x='Condition')
    p.colorbar(label='Value / a.u.')
    doc.add(f'order-{column}', p, row=0, column=column)
doc.save('matrix-order.svg', 'matrix-order.pdf')
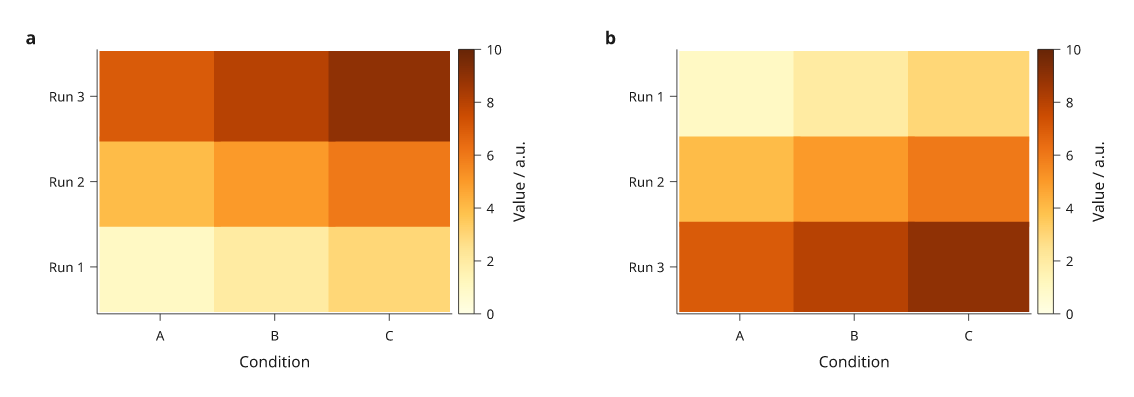
a, First y category at the bottom. b, The category scale is reversed; the input rows and their coordinates stay together. Each named run keeps its values, and both colourbars use the same 0–10 scale.
Numeric sample positions
Without x= and y= on matrix(), cells divide the plot area evenly.
For measurements at uneven numeric positions, pass sample centres explicitly.
Inklet maps those positions through the panel scales and places cell boundaries
halfway between neighbouring displayed samples. The outer cells extend by half
the adjacent gap. A category scale would give every sample an equal-width slot.
import inklet as i

xs, ys = [0, 1, 4], [0.5, 1.5]
p = i.plot_spec(x=(-0.5, 5.5), y=(0, 2), height=42)
p.matrix([[2, 5, 8], [4, 7, 3]], x=xs, y=ys,
         ramp=i.ramp('tol-ylorbr'), scale=i.linear((0, 10)),
         vector='seamless')
p.scatter([(x, y) for y in ys for x in xs], color='#222222', size=1)
p.axes(x='Sample position / mm', y='Height / mm',
       x_options={'ticks': xs}, y_options={'ticks': ys, 'format': '{:.1f}'})
p.colorbar(label='Value / a.u.')
doc = i.document(width=115)
doc.add('samples', p)
doc.save('matrix-samples.svg', 'matrix-samples.pdf')
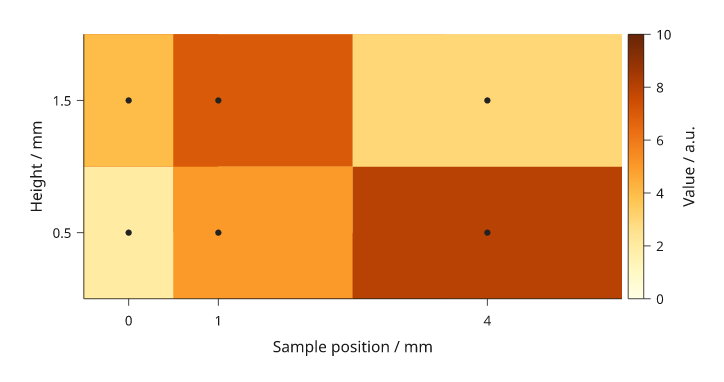
Dots mark supplied sample centres; the colour between samples represents the midpoint-based cell assignment. It does not represent extra observations.
Numeric domains must include the intended cell edges. A singleton row or column fills that panel dimension unless you provide a two-edge interval for it. Uniform edge arrays with one more entry than the number of cells are also accepted. For uneven sampling, supply centres and review the resulting cell boundaries at the final scale.
Default colour ramps
Omit ramp= to use the built-in ramps. matrix() chooses one from the data:
- Values on one side of zero use a sequential ramp: matplotlib's magma, reversed, so low values are pale yellow and high values are deep purple. Lightness falls at a steady perceived rate, so equal value steps look equal. The near-black end is omitted so the darkest cells stay distinct from black text and outlines.
- Values on both sides of zero use Paul Tol's blue-white-red diverging ramp
(
tol-burd), with white at zero. center=selects the diverging ramp and puts white at that value.
Without scale=, the colour scale spans the data. For a diverging ramp it is
made symmetric about the centre, so equal distances above and below the centre
get equally strong colours. colorbar() reads the same scale. An explicit
scale= is used as given; if its domain includes zero, the diverging ramp is
chosen. center= and scale= cannot be combined.
import inklet as i

levels = [[0.4, 1.1, 2.3, 3.0], [0.9, 2.2, 3.6, 4.1], [1.5, 2.8, 4.4, 5.2]]
change = [[-1.8, -0.6, 0.2, 1.4], [-0.9, 0.1, 0.8, 2.1], [-0.2, 0.7, 1.6, 2.6]]
conditions = ['A', 'B', 'C', 'D']
runs = ['Run 1', 'Run 2', 'Run 3']
doc = i.document(width=150, columns=2)
panels = [('level', levels, 'Level / a.u.'), ('change', change, 'Change / a.u.')]
for column, (name, values, key) in enumerate(panels):
    p = i.plot_spec(x=conditions, y=runs, height=30)
    p.matrix(values, x=conditions, y=runs, raster=False)
    p.axes(x='Condition', y='Run')
    p.colorbar(label=key)
    doc.add(name, p, row=0, column=column)
doc.save('matrix-default-ramps.svg', 'matrix-default-ramps.pdf')
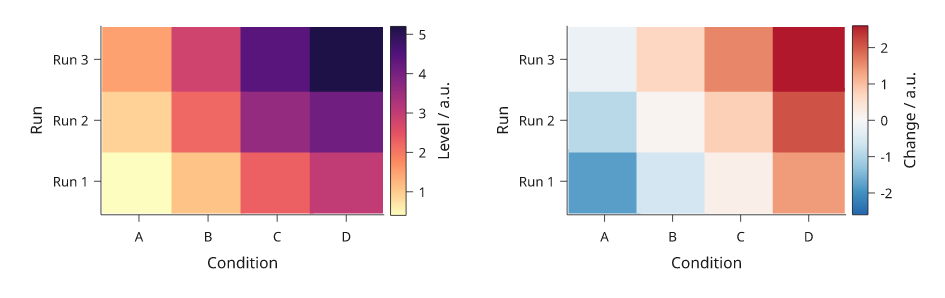
Left: sequential default. Right: diverging default with white at zero.
An explicit ramp= keeps its previous meaning. Without scale=, the values
are read as fractions of the ramp from 0 to 1. Pass ramp=i.ramp('magma') or
ramp=i.ramp('tol-burd') to use either palette with your own scale.
Choose vector or raster cells
These options change the representation of the matrix layer. Axes, labels and colourbars remain vector artwork.
| Option | Representation | Use and limits |
|---|---|---|
raster='auto' (default) |
Individual vector cells up to 2,048 cells; an image above that when displayed spacing is uniform | Uneven spacing stays vector |
raster=False |
One vector rectangle per cell | Individual editing; larger files for dense matrices |
vector='batched' |
Exact same-colour cells grouped into vector paths | Forces vector output and zero overlap; viewers can show pale antialiasing joins |
vector='seamless' |
Batched vector cells with opaque underpaint | Suppresses pale joins while preserving foreground boundaries; requires opaque colours and zero overlap |
raster=True |
An embedded image, one pixel per cell by default | Requires uniform displayed spacing; cells cannot be selected individually |
Ordinary vector cells overlap slightly to hide antialiasing seams; set
overlap=0 for exact abutting rectangles. Batched and seamless modes default
to zero overlap and reject a nonzero override. Raster colour mapping uses
256 ramp levels; batched vector colours are not quantized.
Nearest-cell rendering is the default. Explicit
raster=True, interpolation='linear', samples=4 interpolates scalar values
before applying the colour ramp. samples must be an integer from 2 to 16;
linear interpolation requires uniform displayed spacing and the default
vector='cells'. Missing values affect the interpolation footprint instead of
being filled with zero. Use interpolation only when the figure should show a
continuous field, and describe that choice in the caption.
Dendrograms
dendrogram draws the merge tree of a hierarchical clustering as elbows. It
takes a SciPy linkage matrix, one row [a, b, distance, count] per merge, or
a nested sequence of leaf names such as (('a', 'b'), ('c', 'd')). A nested
tree has no distances, so each merge is drawn one unit above its tallest
child. labels= names the leaves of a linkage in their original order.
With orient='v' (default) the leaves run along x and the merge heights on
y. With orient='h' the leaves run along y and the heights on x. Reverse the
height domain to grow the tree the other way: x=(height, 0) puts the root on
the left and the leaves on the right, next to a heatmap.
To line the tree up with a heatmap, use the same band scale for both. The
band's categories must be in the dendrogram's leaf order, and dendrogram
raises an error when they are not. inklet.plot.dendrogram_layout(tree,
labels=...) returns that order in leaves; reorder the matrix rows and
columns to match. On a y band the first leaf is at the bottom. row and
column align the panels on their plot areas.
threshold= gives each subtree whose merges are all below that height its
own colour and draws the merges above it in the ink.
import inklet as i
from inklet.plot import dendrogram_layout

genes = ['Fos', 'Arc', 'Egr1', 'Npas4', 'Junb', 'Gfap', 'Aqp4', 'Mbp', 'Plp1', 'Mog']
samples = ['S1', 'S2', 'S3', 'S4', 'S5', 'S6']
values = [[1.1, .8, -.8, -2, .1, -.7], [1.9, 1.3, -.5, -1.4, .3, 0],
          [1.2, 1.3, -1.4, -1.3, .4, .1], [1.4, 2, -1, -1.4, .3, -.1],
          [1.4, 1.1, -.3, -1.2, .3, .3], [-.3, -.9, 1.2, 2, -.8, -.1],
          [-.8, 0, 1.1, .3, -.1, -.2], [-.1, .4, -.2, .1, 1.4, 1.9],
          [.5, .2, -.5, .3, 1.8, 1], [-.2, .6, -.3, -.1, 1.7, 1.4]]
# Average-linkage Euclidean clustering of the rows and of the columns.
gene_tree = [[7, 9, .66, 2], [1, 4, .68, 2], [2, 3, .87, 2], [8, 10, 1.12, 3],
             [11, 12, 1.13, 4], [0, 14, 1.43, 5], [5, 6, 2.11, 2],
             [13, 15, 3.19, 8], [16, 17, 4.06, 10]]
sample_tree = [[4, 5, 1.57, 2], [0, 1, 1.7, 2], [2, 3, 2.3, 2], [6, 7, 3.82, 4],
               [8, 9, 5.51, 6]]
rows = list(dendrogram_layout(gene_tree, labels=genes).leaves)
cols = list(dendrogram_layout(sample_tree, labels=samples).leaves)
cells = [[values[genes.index(g)][samples.index(s)] for s in cols] for g in rows]

heat = i.panel(36, 50, x=cols, y=rows)
heat.matrix(cells, x=cols, y=rows, ramp=i.ramp('tol-sunset'),
            scale=i.linear((-2, 2)), raster=False)
heat.axis('bottom', spine=False).axis('right', spine=False)
heat.colorbar(label='z-score', side='bottom')
left = i.panel(12, 50, x=(4.06, 0), y=rows)
left.dendrogram(gene_tree, labels=genes, orient='h', threshold=2)
top = i.panel(36, 8, x=cols, y=(0, 5.51))
top.dendrogram(sample_tree, labels=samples)
fig = i.figure(width=90)
fig.add(i.column([top, i.row([left, heat], gap=1)], gap=1, align='right'))
fig.save('dendrogram.svg', 'dendrogram.pdf')
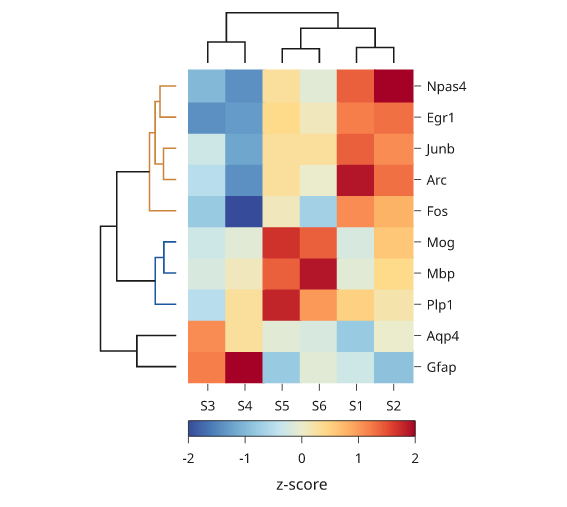
Illustrative values. The gene tree is coloured below a height of 2, which gives two coloured groups. The Gfap and Aqp4 merge, at 2.11, is above the threshold and is drawn in the ink.
Dot plots
dotplot draws one circle per cell, with two values per cell. The circle's
area shows one value, such as the fraction of cells that express a gene. Its
colour shows another, such as the mean expression. Both axes are band scales,
and size[r][c] is drawn at the rth y category and the cth x category.
Colours use the default matrix ramps, or ramp=, scale= and center= as
matrix takes them. A cell whose value is None or NaN draws nothing.
The largest value gets a circle 0.9 of the band step across by default. Set
top= for the value drawn at full size and diameter= for its width. Area is
proportional to value, so a circle for half of top has half the area.
colorbar() explains the colours, and size_key() draws reference circles
with their values. inklet.plot.area_scale(top, diameter) gives the same
size mapping for a scatter: size the points with it and pass it to
size_key(source).
A dendrogram on the same band categories lines up with the rows, as it does with a heatmap.
import inklet as i
import random

genes = ['Cd3e', 'Cd4', 'Cd8a', 'Nkg7', 'Gzmb', 'Ms4a1', 'Cd79a', 'Lyz2', 'Csf1r']
markers = {'CD4 T': {'Cd3e', 'Cd4'}, 'CD8 T': {'Cd3e', 'Cd8a', 'Gzmb'},
           'NK': {'Nkg7', 'Gzmb'}, 'B': {'Ms4a1', 'Cd79a'},
           'Mono': {'Lyz2', 'Csf1r'}, 'DC': {'Lyz2', 'Cd4'}}
tree = ((('CD4 T', 'CD8 T'), 'NK'), ('B', ('Mono', 'DC')))
order = list(i.plot.dendrogram_layout(tree).leaves)
rng = random.Random(3)
fraction = [[rng.uniform(.6, .95) if g in markers[c] else rng.uniform(0, .25)
             for g in genes] for c in order]
mean = [[rng.uniform(1.6, 3) if g in markers[c] else rng.uniform(0, .8)
         for g in genes] for c in order]

dots = i.panel(38, 26, x=genes, y=order)
dots.dotplot(fraction, mean)
dots.axis('bottom', rotate=90, spine=False).axis('right', spine=False)
dots.colorbar(label='Mean expression', length=14)
dots.size_key(title='Fraction', format='{:.0%}')
side = i.panel(9, 26, x=(3, 0), y=order)
side.dendrogram(tree, orient='h')
fig = i.figure(width=90)
fig.add(i.row([side, dots], gap=1))
fig.save('dotplot.svg', 'dotplot.pdf')
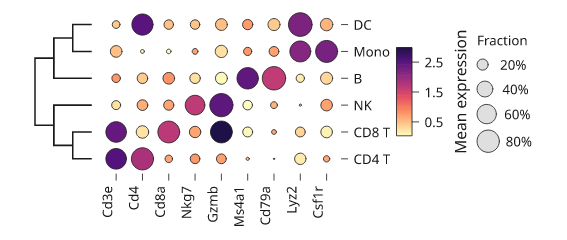
Illustrative values. Each cluster has two or three marker genes with a high fraction and a high mean. The cluster tree is a nested sequence, so its merge heights are levels rather than distances.
Clustered matrices
inklet.plot.linkage(rows, method=, metric=) clusters the rows of a table
hierarchically without SciPy. It returns the merge table SciPy returns, so
dendrogram and dendrogram_layout take it unchanged. The methods are
"average" (default), "single", "complete", "weighted" and "ward".
The metrics are "euclidean", "correlation", "cosine", "cityblock", a
function, or "precomputed" for a distance matrix. cut(link, k) returns
one cluster number per row, numbered in the tree's leaf order, so once the
matrix is reordered by dendrogram_layout(link).order each cluster is a run
of consecutive rows.
clusters(groups) draws a box on the diagonal around each run of equal
labels in groups, one label per matrix row from the top. highlight= draws
chosen clusters in red over the others, and labels=True names each cluster
to the right of the matrix.
To magnify part of the matrix, pass zoom=(x0, x1, y0, y1) to inset.
Style keywords colour the window; connector= styles the connector lines
alone, for example dashed.
import inklet as i
import random
from inklet.plot import cut, dendrogram_layout, linkage

rng = random.Random(5)
n = 40
community = [k % 5 for k in range(n)]
rng.shuffle(community)
weights = [[0.0] * n for _ in range(n)]
for a in range(n):
    for b in range(a):
        linked = rng.random() < (0.7 if community[a] == community[b] else 0.05)
        weights[a][b] = weights[b][a] = linked * rng.uniform(0.3, 1)
link = linkage(weights, metric='correlation')
order = dendrogram_layout(link).order
groups = [cut(link, 5)[k] for k in order]
adjacency = [[weights[a][b] for b in order] for a in order]
scale = i.linear((0, 1))
m = i.panel(50, 50, x=(0, n), y=(n, 0))
m.matrix(adjacency, scale=scale).clusters(groups, highlight=2, labels=True)
zoom = i.panel(24, 24)
zoom.matrix([row[8:16] for row in adjacency[8:16]], scale=scale)
m.inset(zoom, side='right', width=None, zoom=(8, 16, 8, 16), stroke='#c9352b',
        stroke_width=0.35, connector={'stroke_dash': (1, 0.6)})
m.colorbar(side='bottom', label='weight', length=24)
fig = i.figure(width=100)
fig.add(m.build())
fig.save('clusters.svg', 'clusters.pdf')
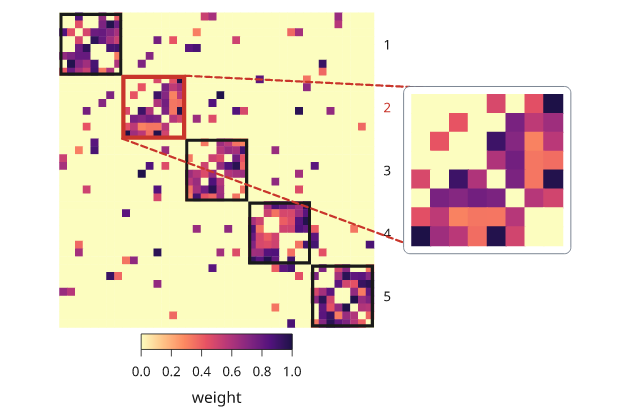
Simulated network of five communities. The rows are in the dendrogram's leaf order, so each community is one box on the diagonal; the inset magnifies the highlighted one.
Clustermaps
inklet.clustermap(values) builds the whole clustered heatmap. It clusters
the rows and columns, reorders the matrix, and adds both dendrograms,
annotation strips, a colorbar and the row and column names when there is
room for them. standardize="rows" z-scores each row first. k= cuts the
row tree into clusters, colours the tree by cluster, and separates the
clusters with rules. When the matrix is square with the same order on both
axes, such as a correlation matrix, the clusters are boxed on the diagonal
instead. row_color= and col_color= map a track name to one value per
row or column: colours, or categories that are coloured from the palette and
named in a legend.
import inklet as i
import random

rng = random.Random(7)
genes = ['Fos', 'Arc', 'Egr1', 'Npas4', 'Junb', 'Gfap', 'Aqp4', 'Aldh1l1',
         'Mbp', 'Plp1', 'Mog', 'Olig2']
samples = [f'S{k}' for k in range(1, 10)]
condition = ['ctrl', 'ctrl', 'ctrl', 'KA', 'KA', 'KA', 'LPS', 'LPS', 'LPS']
signal = {'ctrl': 8, 'KA': 0, 'LPS': 4}
expression = [[rng.gauss(2.5 if signal[c] <= g < signal[c] + 4 else 0, 0.8)
               for c in condition] for g in range(12)]
cm = i.clustermap(expression, rows=genes, columns=samples, standardize='rows', k=3,
                  col_color={'condition': condition}, label='z-score', width=36)
fig = i.figure(width=100)
fig.add(cm)
fig.save('clustermap.svg', 'clustermap.pdf')
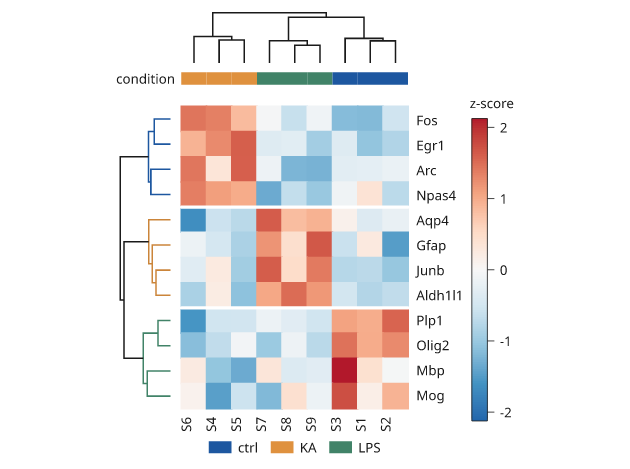
Simulated expression. Three gene modules respond to three conditions, and
the row tree is coloured by the three clusters k=3 cuts.
Correlograms
correlogram(r, name) draws a correlation matrix as a triangle of glyphs.
Each glyph's area is proportional to |r| and its colour is r on a diverging
ramp fixed from -1 to 1, so colorbar() shows the full scale.
inklet.plot.correlation(table) computes Pearson r between rows, or columns
with by="columns". triangle="lower" (default) and "upper" draw each pair
once without the diagonal. shape= is "circle", "square" or "tile", and
values=True writes r in each glyph.
import inklet as i
import random
from inklet.plot import correlation

rng = random.Random(8)
genes = ['Gad1', 'Gad2', 'Slc32a1', 'Pvalb', 'Sst', 'Vip', 'Slc17a7', 'Satb2']
base = [[rng.gauss(0, 1) for _ in range(40)] for _ in range(3)]
module = [0, 0, 0, 1, 1, 2, 2, 2]
sign = [1, 1, 1, 1, -1, -1, 1, 1]
table = [[sign[g] * base[module[g]][k] + rng.gauss(0, 0.7) for k in range(40)]
         for g in range(8)]
r = correlation(table)
dots = i.panel(40, 40).correlogram(r, genes).colorbar(label='r', length=24)
tiles = i.panel(40, 40).correlogram(r, genes, triangle='upper', shape='tile', values='{:.1f}')
fig = i.figure(width=130)
fig.add(i.row([dots, tiles], gap=14, align='top'))
fig.save('correlogram.svg', 'correlogram.pdf')
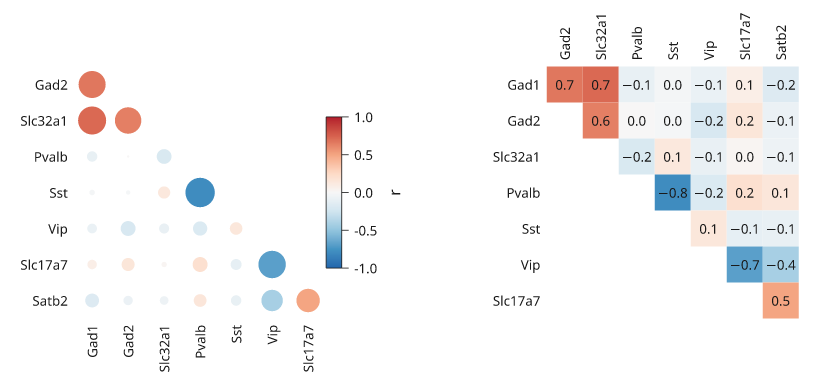
Simulated expression of three gene modules. Colour gives the sign of r and circle area its strength.
Next steps
Compare plot types, configure axes and scales, or arrange several panels. For exact options, see the API.