

On this page
Networks and hierarchies
These plots fill a panel's plot area with a structure rather than plotting against its scales: a tree of nested groups, or nodes joined by weighted edges. Sizes are in millimetres like everything else, and every plot here leaves a note on its node with the geometry it drew, so a test can check the picture against the numbers.
Hierarchy input
treemap, icicle and sunburst take the same hierarchy, in any of three
spellings. inklet.plot.hierarchy(data) reads it and returns the tree, so
you can check what a plot will draw.
- A nested mapping:
{"cortex": {"L5": {"ET": 40, "IT": 65}, "L6": 80}}. A leaf is a number; a list of names is leaves of 1 each. Several top-level keys share an unnamed root. (name, children)tuples:("cortex", [("L5", [("ET", 40), ("IT", 65)]), ("L6", 80)]).- A table of
(name, parent[, value])rows, withNoneas the root's parent.
A group's value is the sum of its children. Nodes are found by name, or by path (a tuple of names from below the root) when names repeat.
Treemaps and sunbursts
treemap tiles the plot area with one rectangle per leaf, its area
proportional to the value, using the squarified layout so the cells stay
close to square. Groups become pale plates with their name in a header strip.
sunburst draws the same tree as rings: the root in the middle, each level
one ring further out, and each node's angle proportional to its value.
Colours follow the branch: each child of the root gets a colour from the
theme's palette, lightened for deeper levels. color= takes a list per
branch, a mapping of names to colours, or one colour. highlight= draws the
named nodes in red and everything else pale. Labels are written only where
they fit inside their cell.
import inklet as i

cortex = {'cortex': {'L2/3 IT': 120, 'L4/5 IT': 90, 'L5 ET': 40, 'L6 IT': 55, 'L6 CT': 70,
          'Inhibitory': {'Pvalb': 45, 'Sst': 38, 'Vip': 22, 'Lamp5': 18, 'Sncg': 6},
          'Non-neuronal': {'Astro': 50, 'Oligo': 64, 'OPC': 15, 'Micro': 12}}}
tree = i.panel(60, 40).treemap(cortex, values='{:.0f}')
rings = i.panel(40, 40).sunburst(cortex)
fig = i.figure(width=120)
fig.add(i.row([tree, rings], gap=6))
fig.save('treemap.svg', 'treemap.pdf')
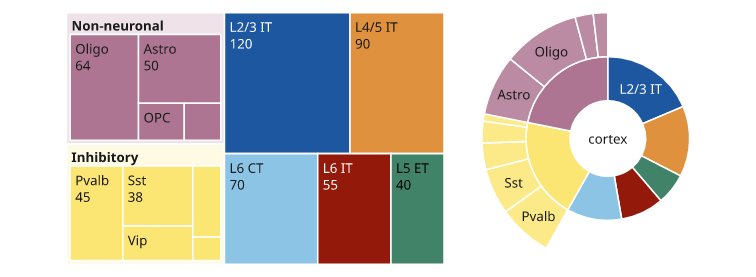
Illustrative counts. The inhibitory and non-neuronal groups are plates with their children inside; the sunburst's inner ring is the same groups.
Clustering levels
icicle draws each level of the tree as a row of bars whose widths are the
values. With gap= the levels separate and pale fans join each node to its
children, which is the usual way to show how clusters split from one level of
resolution to the next. orient="h" (default) runs the levels as columns
from left to right; "v" runs them as rows from the top.
highlight= marks a lineage in red. labels="highlight" names only the
highlighted nodes, or pass the names or paths to label. Long names go
outside the bars with a leader tick. levels=True numbers the levels on the
left and counts=True writes how many nodes each level has on the right, with
the number of highlighted nodes in red.
import inklet as i

levels = {'1': {'1.1': {'1.1.1': 8, '1.1.2': 5}, '1.2': {'1.2.1': 6, '1.2.2': 3, '1.2.3': 2}},
          '2': {'2.1': {'2.1.1': 7, '2.1.2': 7},
                '2.2': {'2.2.1': 4, '2.2.2': 3, '2.2.3': 2, '2.2.4': 2}}}
lineage = [('2',), ('2', '2.2'), ('2', '2.2', '2.2.2')]
p = i.panel(40, 50)
p.icicle(levels, gap=3, highlight=lineage, labels='highlight', levels=True, counts=True)
fig = i.figure(width=70)
fig.add(p.build())
fig.save('icicle.svg', 'icicle.pdf')
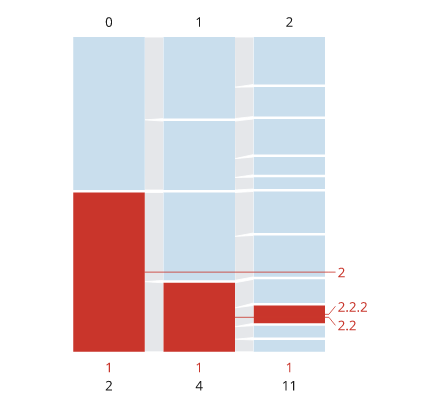
Illustrative clusters. The highlighted lineage is red at every level, and the counts on the right give the number of clusters and highlighted clusters per level.
Weighted networks
network draws nodes and weighted edges. nodes is a list of names or a
mapping of name to value; edges are (source, target),
(source, target, weight) or (source, target, weight, category) rows.
- Layout.
layout="circular"(default) puts the nodes on one ring from twelve o'clock, in input order ororder=, and bows each edge towards the centre."force","layered"and"tree"use the solvers ofinklet.graph, stretched to fill the area, with straight edges. - Nodes. A node's area is proportional to its value, with a floor so
small nodes stay visible;
size=(a mapping or one value per node) gives the values whennodesis a list.shape="square"draws rounded squares.groups=colours nodes by category, andlegend()names the groups.color=is the fill of ungrouped nodes, or a mapping of node or group names to colours. - Edges. Width is proportional to weight, from a hairline floor up to
width(1.6 mm). Lighter edges are drawn first. Edge categories get their own colours and legend entries;edge_color=maps categories to colours.arrows=Trueadds heads, and two opposite edges bow to opposite sides.
width_key() explains the edge widths with reference lines, and
size_key() the node areas. Names are written inside a node when they fit
and outside it otherwise, at label_size.
import inklet as i

neurons = {'AVA': 60, 'AVB': 34, 'AVD': 22, 'AVE': 28, 'PVC': 25, 'RIM': 18,
           'AIB': 16, 'DVA': 12, 'RIB': 10, 'SMD': 9}
synapses = [('AVA', 'AVD', 5200, 'chemical'), ('AVD', 'AVA', 1800, 'chemical'),
            ('AVE', 'AVA', 4100, 'chemical'), ('AVB', 'PVC', 900, 'gap junction'),
            ('PVC', 'AVB', 3300, 'chemical'), ('RIM', 'AVA', 2500, 'gap junction'),
            ('AIB', 'RIM', 1600, 'chemical'), ('AIB', 'AVE', 700, 'chemical'),
            ('DVA', 'AVB', 450, 'gap junction'), ('RIB', 'AVE', 300, 'chemical'),
            ('SMD', 'RIB', 1200, 'gap junction'), ('AVA', 'SMD', 200, 'chemical')]
command = {n: 'command' for n in ('AVA', 'AVB', 'AVD', 'AVE', 'PVC')}
p = i.panel(55, 55)
p.network(neurons, synapses, shape='square', diameter=6, arrows=True,
          groups={n: command.get(n, 'other') for n in neurons},
          color={'command': '#c0392b', 'other': '#bdbdbd'},
          edge_color={'chemical': '#4d4d4d', 'gap junction': '#e69f00'})
p.width_key(title='synapses', values=[5000, 2000, 500], format='{:,.0f}')
p.legend(side='bottom')
fig = i.figure(width=89)
fig.add(p.build())
fig.save('network.svg', 'network.pdf')
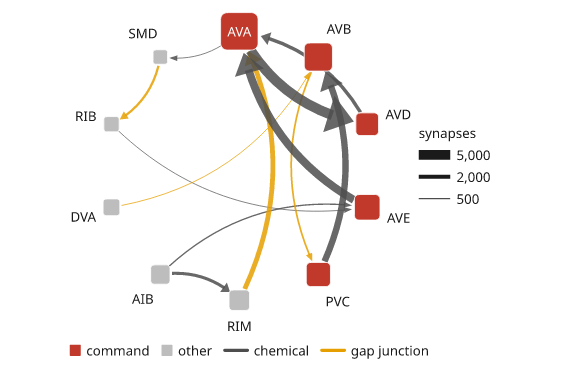
Illustrative weights. Command interneurons are red, and the width key reads edge weight in synapses.
Chord and arc diagrams
chord puts groups on a ring as arcs proportional to their totals and joins
them with ribbons proportional to the flows. matrix[i][j] is the flow from
group i to group j. Undirected (the default), a ribbon is matrix[i][j] wide at
i and matrix[j][i] wide at j. directed=True counts each group's outgoing
and incoming flows and points each ribbon at its target.
arc_diagram puts the nodes in a row and draws each edge as a half-ellipse
above it, with the same node and edge encodings as network. With
directed=True, edges that run right to left hang below the row.
import inklet as i

areas = ['V1', 'LM', 'AL', 'RL', 'AM', 'PM']
flows = [[0, 18, 9, 7, 4, 11], [16, 0, 8, 3, 2, 5], [7, 9, 0, 6, 3, 2],
         [5, 2, 7, 0, 6, 3], [3, 1, 2, 7, 0, 8], [12, 4, 1, 2, 9, 0]]
chords = i.panel(45, 45).chord(flows, areas, directed=True)
genes = ['Rbfox3', 'Snap25', 'Syt1', 'Gad1', 'Gad2', 'Slc32a1', 'Olig2', 'Sox10', 'Mbp']
pairs = [('Rbfox3', 'Snap25', 8), ('Snap25', 'Syt1', 9), ('Rbfox3', 'Syt1', 5),
         ('Gad1', 'Gad2', 9), ('Gad2', 'Slc32a1', 7), ('Gad1', 'Slc32a1', 6),
         ('Olig2', 'Sox10', 8), ('Sox10', 'Mbp', 9), ('Olig2', 'Mbp', 4),
         ('Syt1', 'Gad1', 2), ('Snap25', 'Mbp', 1)]
module = {g: 'neuronal' for g in genes[:3]}
module.update({g: 'inhibitory' for g in genes[3:6]}, **{g: 'glial' for g in genes[6:]})
arcs = i.panel(70, 28).arc_diagram(genes, pairs, groups=module)
arcs.width_key(title='co-expression').legend(side='bottom')
fig = i.figure(width=160)
fig.add(i.row([chords, arcs], gap=8))
fig.save('chord.svg', 'chord.pdf')
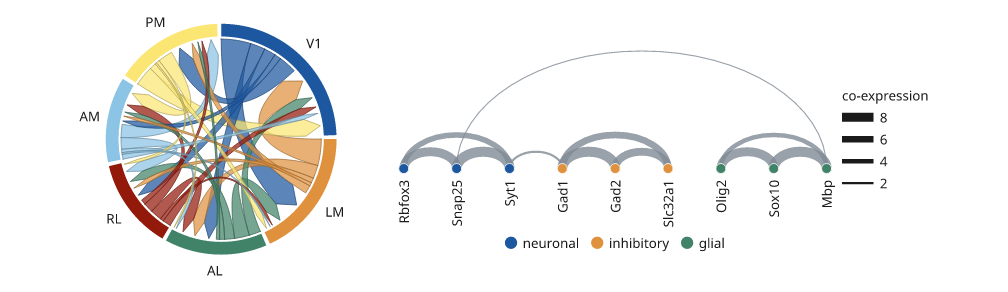
Illustrative flows. In the chord diagram each ribbon is coloured by its source and points at its target.
Next steps
Cluster a matrix, compare plot types, or arrange several panels. For exact options, see the API.