

On this page
Colour palettes
Inklet ships 98 palettes: 21 categorical sets, 49 sequential maps, 23
diverging maps and 5 cyclic maps. Each one records where its values come
from and under what licence, and each has been measured. Every swatch on
this page was drawn by Inklet itself with tools/palette_sheet.py.
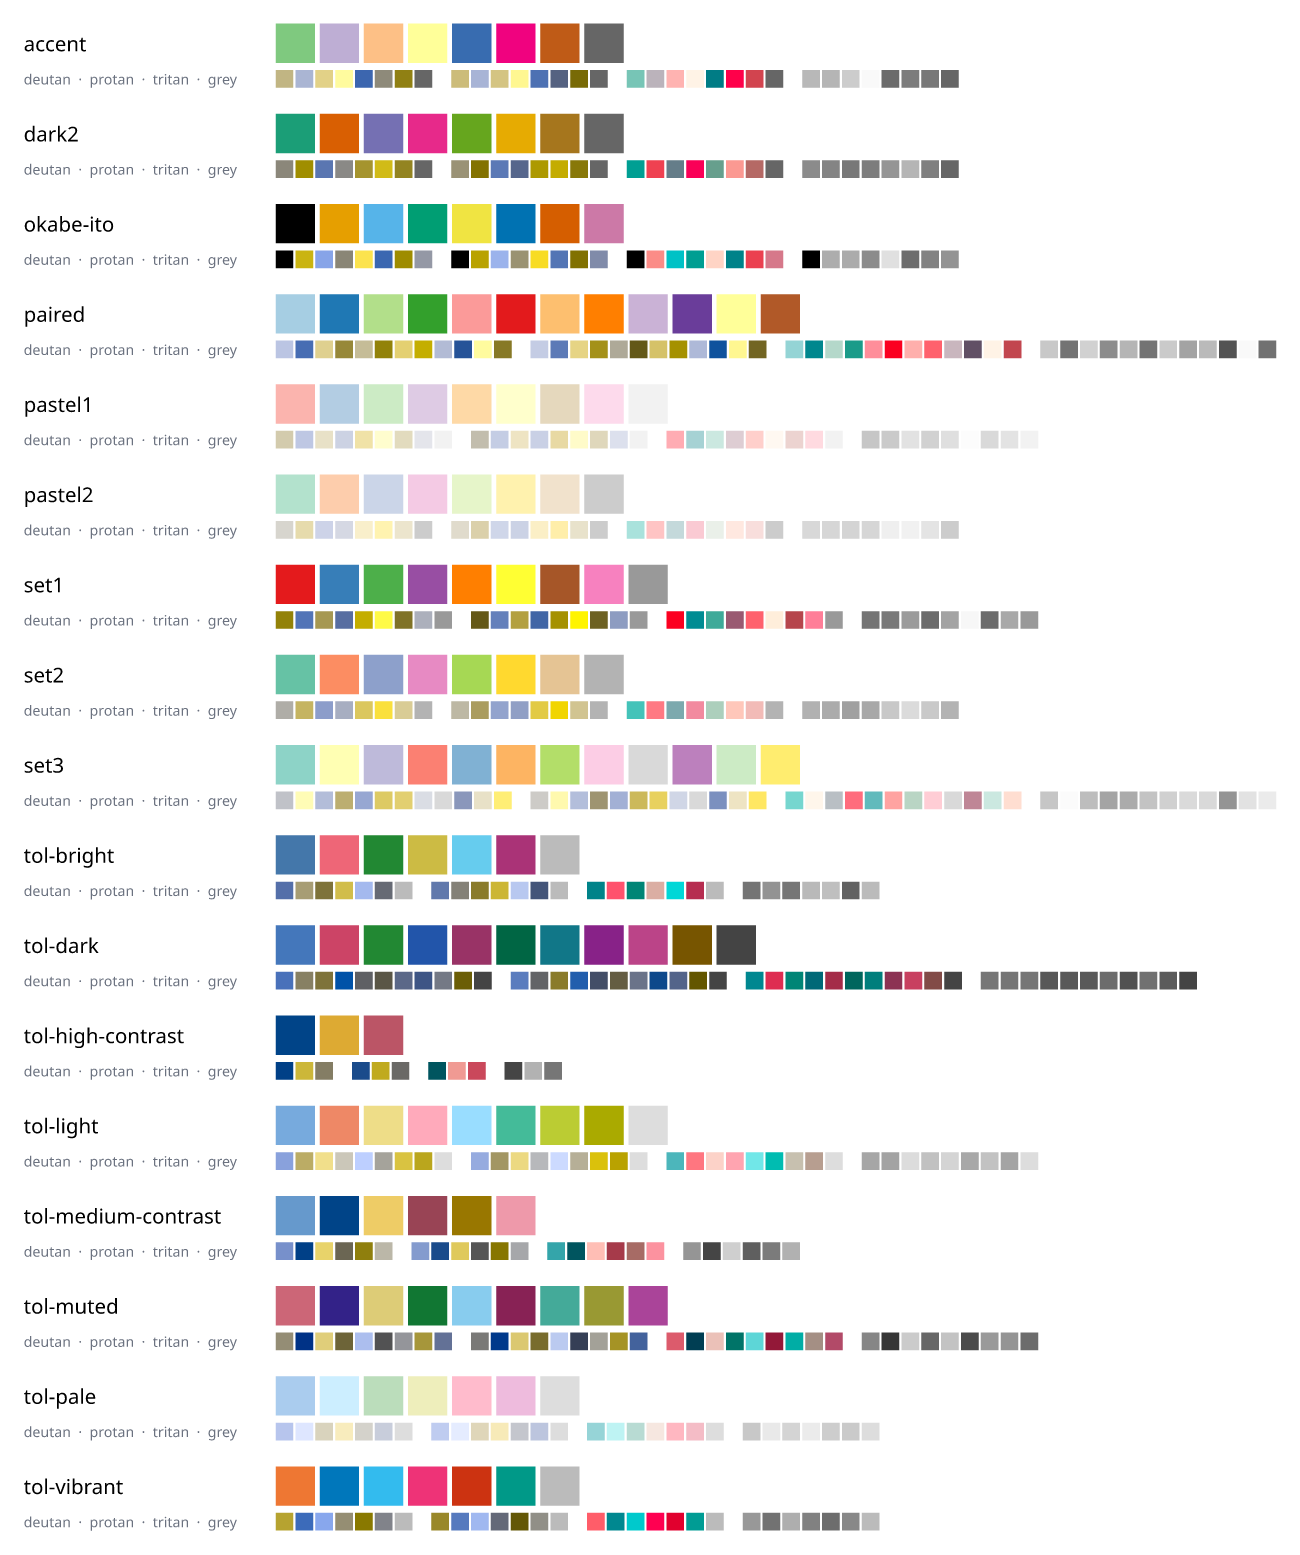
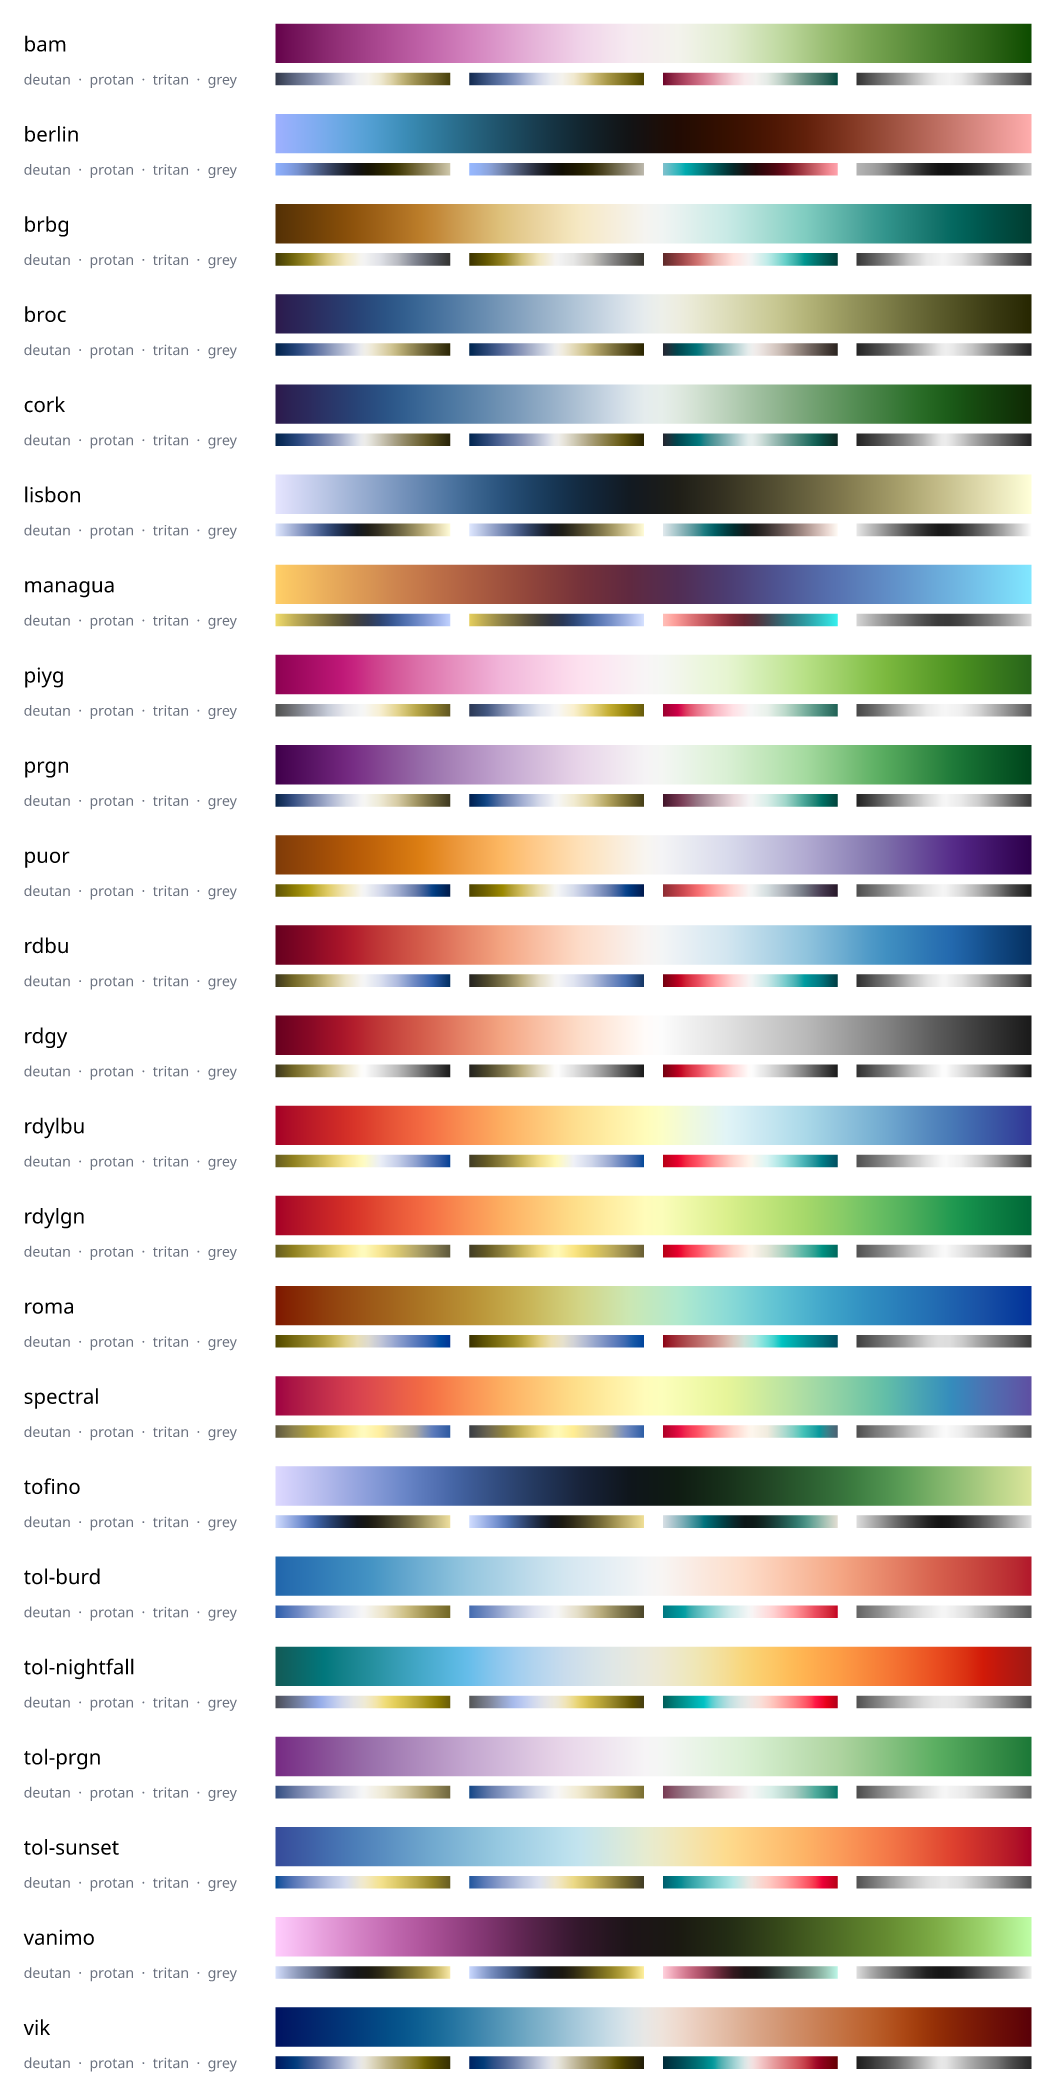
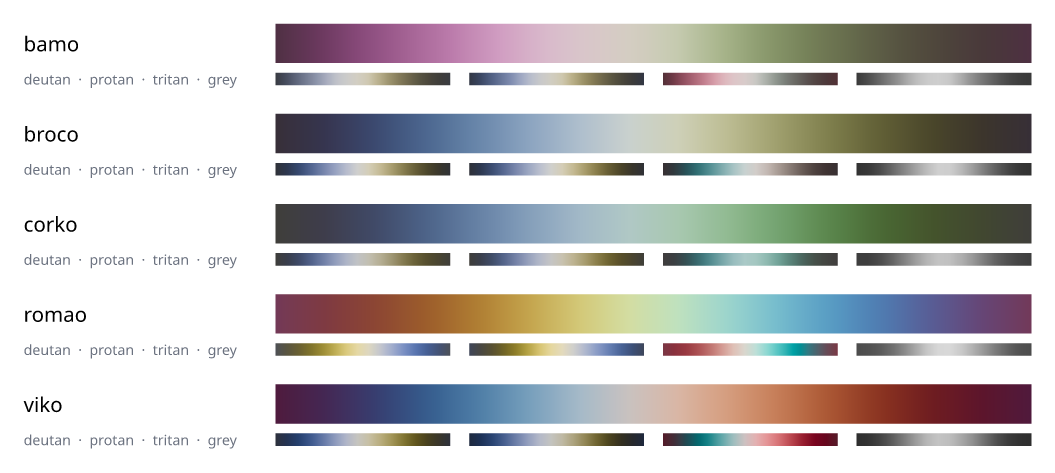
The small strips under each palette show how it looks under the three dichromacies (simulated with Machado et al. 2009 at full severity) and in greyscale. Use them to check that the colours you rely on still separate for every reader.
Default series colours
Since 4.4 the nature and notebook themes colour series with the inklet
palette; slides keeps tol-bright, which holds up better on a projector.
Before 4.4, nature used Okabe-Ito and notebook used tol-muted. To keep
the old colours, give the theme its old palette:
import inklet as i
from inklet.themes import NATURE

old = NATURE.with_palette("okabe-ito")       # the 4.3 nature colours
i.use_theme(old)
fig = i.figure(width=89, theme=old)
NOTEBOOK.with_palette("tol-muted") does the same for the notebook theme, and
preset(...).customize(palette=...) for a preset. The presets set their own
palettes and did not change.
Inklet's own palettes
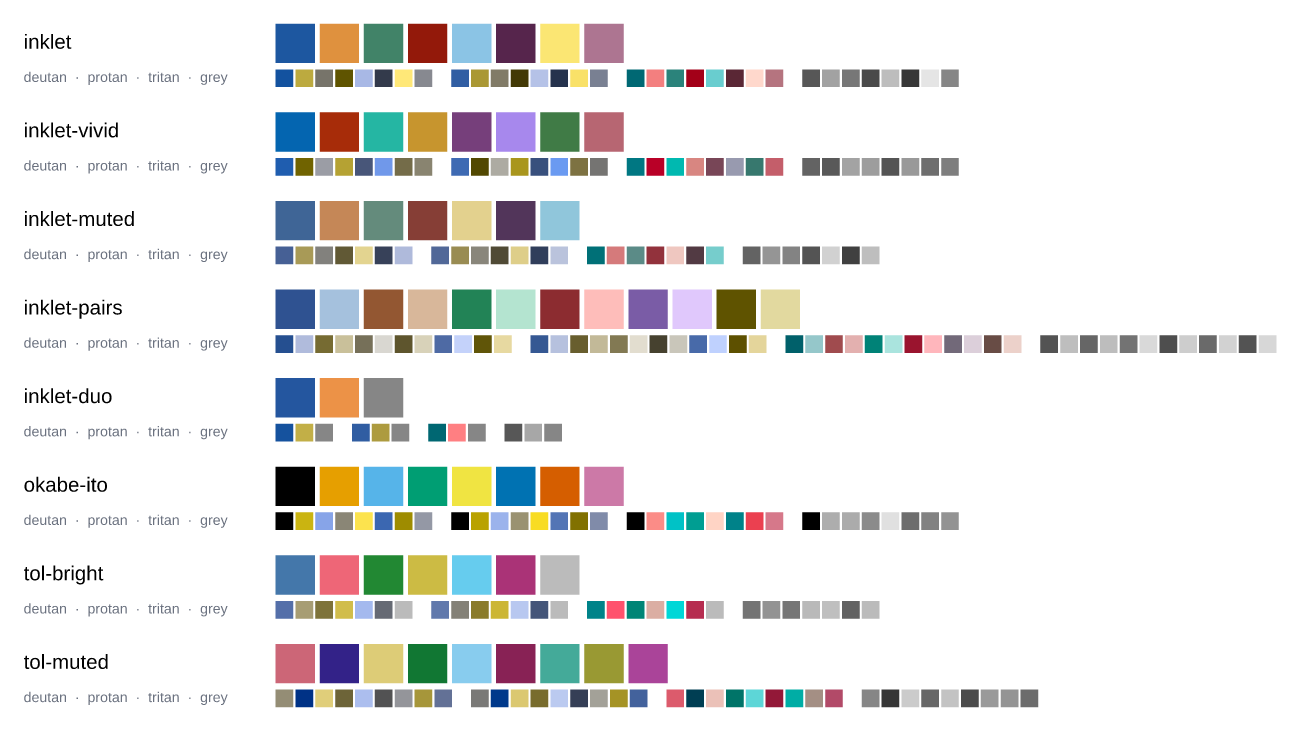
These four were designed for Inklet in OKLCH. Each was optimised against the
smallest CIEDE2000 distance (ΔE00) between any two colours, both in normal
vision and in the worse of two simulations (Machado 2009 and Viénot 1999)
for each dichromacy. The categorical set is also kept apart in greyscale.
The numbers below are asserted in tests/test_palettes.py. Okabe-Ito and
two Tol sets are shown below them for comparison. In the table, the CVD columns are the worse of the two simulations; report() gives the Machado figures alone.
| Palette | Colours | min ΔE00 normal | deutan | protan | tritan | min greyscale gap (L*) |
|---|---|---|---|---|---|---|
inklet |
8 | 25.9 | 12.4 | 17.6 | 12.4 | 5.5 |
inklet-muted |
7 | 23.5 | 13.4 | 13.9 | 12.9 | 6.5 |
inklet-pairs |
12 | 15.1 | 6.0 | 5.6 | 5.8 | – |
inklet-duo |
3 | 27.8 | 27.7 | 24.1 | 25.0 | 12.7 |
inklet-vivid |
8 | 23.5 | 10.5 | 11.0 | 8.4 | 1.5 |
okabe-ito |
8 | 21.7 | 11.5 | 12.3 | 0.6 | 0.8 |
inklethas eight colours: cobalt, amber, teal, brick, sky, plum, butter and rose. Every pair stays at least 12 ΔE00 apart for all three dichromacies, and at least 5 L apart in greyscale. Okabe-Ito's vermillion and reddish purple come within 0.6 of each other for a tritanope (Viénot simulation). Its orange and sky blue fall within 1 L of each other in greyscale.inklet-muteduses the same recipe at lower chroma: slate, clay, sage, rust, straw, dusty plum and mist. It suits print journals, and figures where colour should support the data rather than dominate it.inklet-pairshas six hues, each with a dark and a light member (colours2kand2k+1). Use it for grouped data such as control/treated within each condition. Twelve colours in pairs cannot all stay far apart under CVD: ColorBrewer'spaireddrops to 1.3 ΔE00 for a protanope. Let the pairing carry the meaning, and use direct labels.inklet-vividis the palette of one-call charts and thescientific.modernpreset: a deep blue lead, then rust, teal, gold, plum, lavender, forest and rose. Every colour is a mid tone that holds up as a thin line or a small marker on white, so a lone series can wear the lead blue. The first four stay at least 36.9 ΔE00 apart in normal vision and 17.1 under any dichromacy. Eight mid tones cannot also separate in greyscale; useinkletwhen a figure may be printed in black and white.tools/design_palette.pyreproduces the search.inklet-duois for two conditions (or sexes) plus a neutral reference. Blue and orange are the hue pair that every dichromat keeps apart, and the lightness step keeps them apart in greyscale too.
import inklet as i
from inklet.themes import NATURE, palette

theme = NATURE.with_palette("inklet-muted")  # a theme with the muted set
print(NATURE.color(0), NATURE.color(1))      # #1d57a0 #df913e, the default
print(palette("inklet").report())
Categorical sets
This section includes Okabe-Ito, Paul Tol's qualitative schemes (tol-bright,
tol-vibrant, tol-muted, tol-medium-contrast, tol-high-contrast,
tol-light, tol-pale and tol-dark) and ColorBrewer's qualitative sets.
Brewer's set1, set2, set3, pastel*, dark2, accent and paired
were designed before CVD simulation was routine, and several of their pairs
collapse under it: set2 drops to 1.6 ΔE00 for a protanope. The previews show
which pairs are affected.
Sequential maps
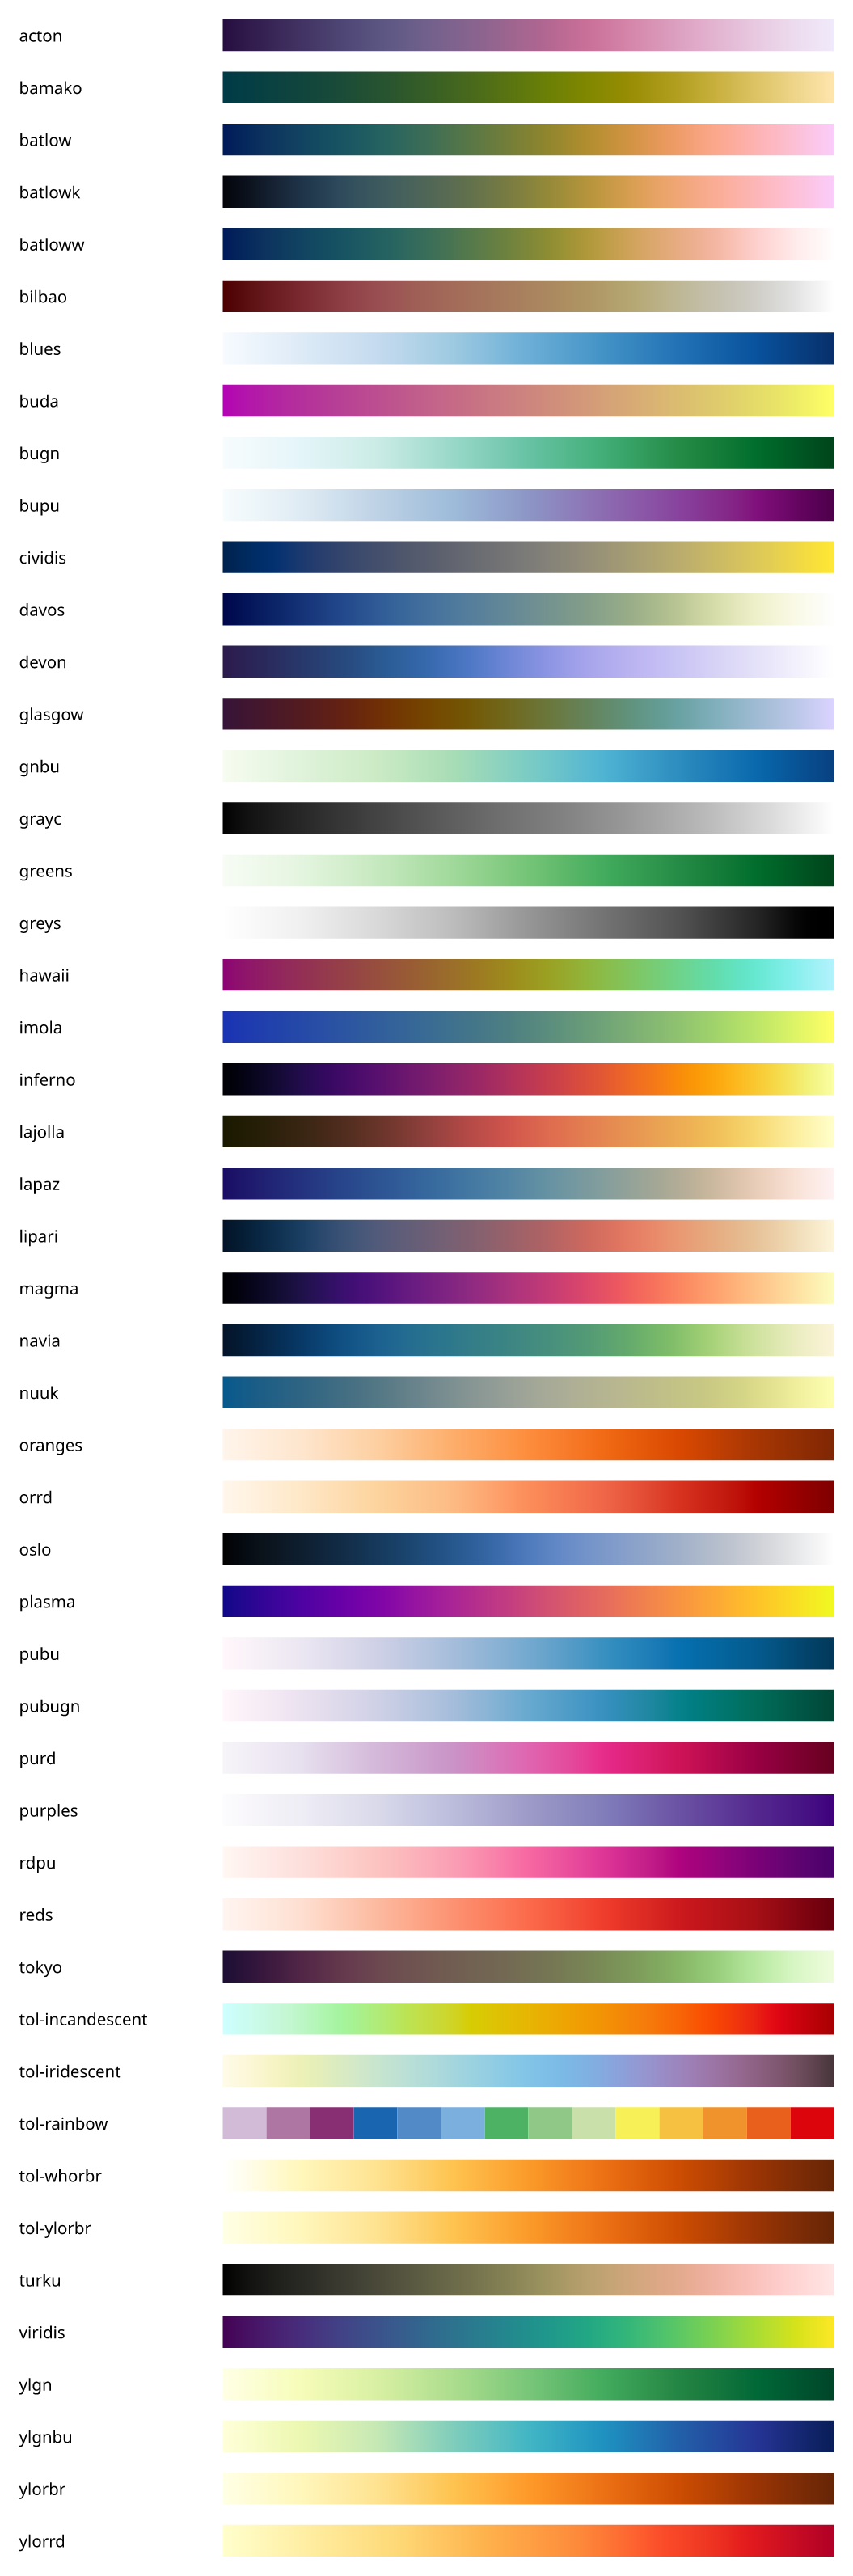
The perceptually uniform maps are matplotlib's viridis, inferno, plasma and
magma, cividis (built to look almost the same to a deuteranope), and 21 of
Fabio Crameri's Scientific colour maps. Each is stored with enough of its
published 256 entries that interpolating in OKLab, CIELAB or sRGB reproduces
the full table within ΔE00 1. The collection also includes Tol's tol-ylorbr,
tol-whorbr, tol-iridescent and tol-incandescent, and ColorBrewer's
sequential schemes. Every sequential map except one is monotonic in
lightness: it reads correctly in greyscale and to every reader. The
exception is tol-rainbow, a discrete 14-step sequence of hues for ordered
classes. Use its colours as given; do not interpolate them.
Diverging maps
A diverging map has a single lightness extreme at its centre, with lightness
changing monotonically along both arms; the tests check every diverging map
for this. report().asymmetry gives the largest L difference between
mirrored stops. Tol's tol-sunset, tol-nightfall and tol-burd, and
Crameri's roma and managua, mirror within 5 L. Some published maps are
lopsided: ColorBrewer's puor is off by 24 L*. berlin, lisbon,
tofino and vanimo are dark in the middle. They suit dark backgrounds, or
data where the centre should recede.
Cyclic maps
These are Crameri's bamO, brocO, corkO, romaO and vikO, stored as
bamo and so on. Their ends meet, so use them for phase, direction or time
of day.
Choosing a palette
- Unordered categories: use
inklet,okabe-itoortol-bright, with no more colours than you have categories. Past eight categories, use direct labels or faceting instead of more hues. - Ordered quantities: use a sequential map.
viridis,cividisandbatloware safe choices. Avoid rainbow maps for continuous data: they create boundaries that are not in the data. - Deviations from a meaningful centre: use a diverging map, with
center=set on the matrix so the lightness extreme sits at that value. - Angles and phases: use a cyclic map.
- Greyscale printing: check
report().min_lightness_gapfor categorical sets. A sequential map passes if it is monotonic in lightness.
Using palettes
Look up any palette by name, case-insensitively. A trailing _r reverses it,
as in matplotlib. Ramps accept names directly:
import inklet as i
from inklet.plot import panel
from inklet.themes import palette, palette_names

print(len(palette_names("diverging")))       # 23
viridis = palette("viridis")
five = viridis.resampled(5)                  # 5 colours, OKLab-interpolated
dark_first = palette("batlow_r")

p = panel(40, 30).matrix([[0.1, 0.5], [0.9, 0.3]], ramp="viridis")
p.colorbar()
shade = i.ramp("vik", space="oklab")         # a callable ramp, 0..1 -> colour
The same names work for scatter(..., ramp="batlow"), for
Theme.with_palette(...), and for preset(...).customize(palette="inklet-muted").
A theme's series colours must be categorical, so for a theme take a ramp's
colours explicitly: palette("viridis").resampled(6).
Measuring a palette
Palette.report() returns a PaletteReport with the following fields:
min_delta_e: the smallest pairwise ΔE00.min_delta_e_cvdandworst_pairs: the smallest ΔE00 under each simulated dichromacy, and which pair sets it.lightness: the CIE L* of each colour.min_lightness_gap: the smallest gap between the sorted L* values.monotonicandsymmetric: whether a ramp is monotonic in lightness, and whether a diverging map is symmetric.
Palette.cvd(kind) returns the palette as a reader with that deficiency sees
it. Palette.greyscale() returns the palette at the same L* with no colour.
The colour science is in inklet.themes.color. It includes OKLab and OKLCH
(to_oklab, from_oklch, interpolate_oklab), CIEDE2000 (delta_e_2000,
checked against Sharma et al. 2005) and simulate_cvd(color, kind,
method="machado", severity=...). The default simulation remains Viénot's.
from inklet.themes import palette

r = palette("set2").report()
print(round(r.min_delta_e_cvd["protanopia"], 1), r.worst_pairs["protanopia"])
Sources and licences
| Palettes | Source | Licence |
|---|---|---|
| viridis, inferno, plasma, magma | Smith & van der Walt (matplotlib 3.9.2 tables) | CC0 1.0 |
| cividis | Nuñez, Anderton & Renslow, PLoS ONE 2018 | BSD-style, Battelle Memorial Institute |
| Crameri maps | Crameri, Scientific colour maps 8.0, doi:10.5281/zenodo.8035877 | MIT |
| ColorBrewer | Brewer, Harrower & Penn State, colorbrewer2.org | Apache-2.0 |
tol-* |
Paul Tol, SRON/EPS/TN/09-002 and his web page | no licence stated; published for general use |
okabe-ito |
Okabe & Ito, Color Universal Design (2008) | no licence stated; published as a recommendation |
inklet* |
Inklet | MIT |
The full notices are in
THIRD_PARTY_NOTICES.md.
Journal-branded sets are not included. ggsci's are GPL, and Tableau's are
proprietary. inklet-muted offers the restrained journal look under
Inklet's own licence.