

On this page
Shared plotting quality
The recorded comparison below preserves the 4.0.0.dev1 baseline; see the 4.0 release guide for release and environment details.
The common scale engine improves numeric ticks in the cases below. These fixes apply to ordinary plots, color scales and measured browser axes. These fixes were absent from the 3.1.0 baseline.
Complete Python recipe · Earlier output for comparison

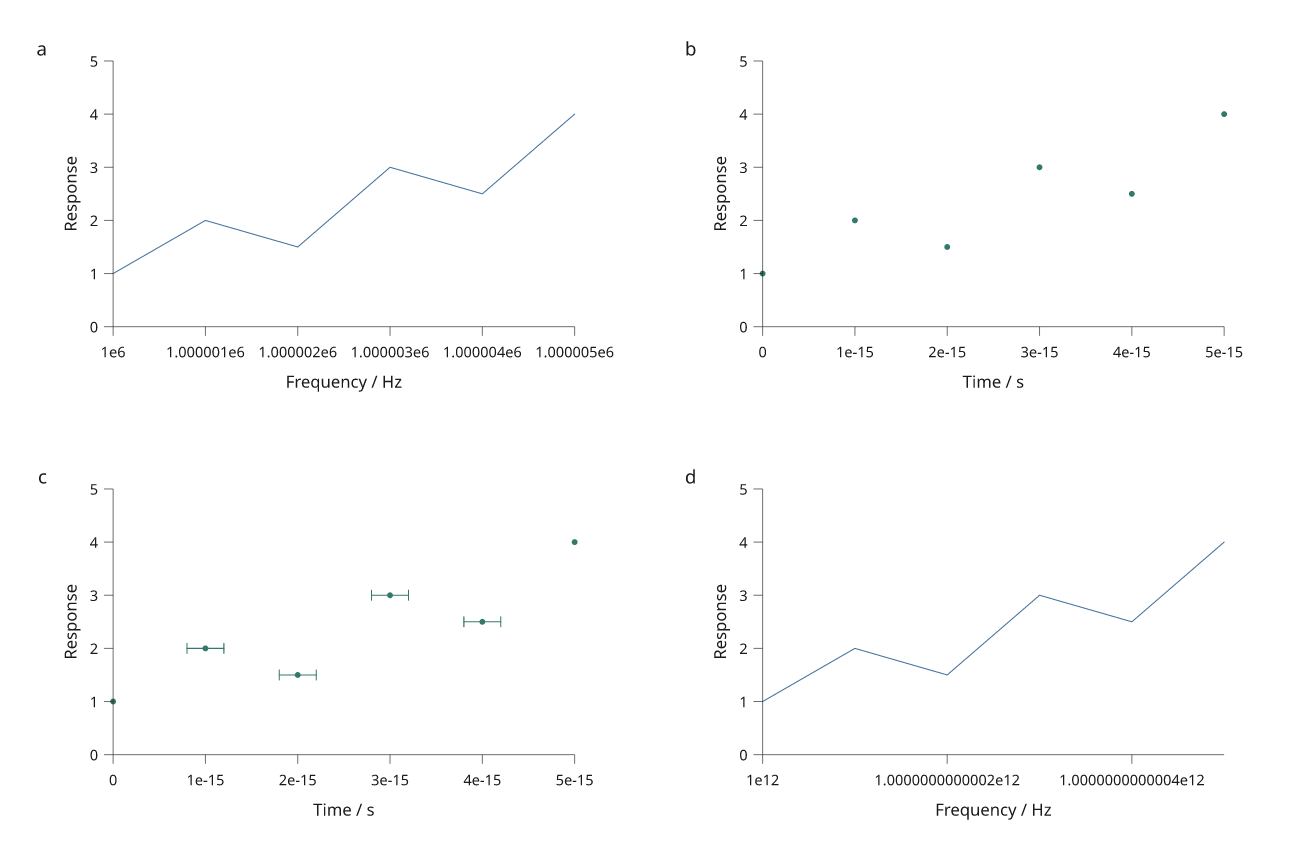
The figure uses original simulated values by Mark Marosi, released under MIT. Panel a varies by five units around one million; panel b spans five femtoseconds; panel c adds supplied 0.2-femtosecond error distances; panel d varies by half a unit around one trillion. Captions stay outside the artwork.
What changed
| Case | Earlier behavior | Current behavior |
|---|---|---|
| Narrow range around a large baseline | Distinct ticks could all read 1e6 |
Scientific labels preserve the tick spacing |
| Very small magnitudes | Rounding could collapse femtosecond ticks to zero | Small-scale positions and labels are retained |
| Narrow but representable ranges | A relative tolerance could collapse the range to one tick | Distinct positions remain available to measured layout |
| Near floating-point resolution | Lattice arithmetic could repeat ticks or move them outside the domain | Returned ticks are distinct and inside the domain |
Labels are measured before thinning, so added precision participates in layout. Checks cover all four axis sides, reversed domains, negative and tiny values, and one-representable-step ranges. Ordinary formatting retains its behavior.
Very narrow ranges around large offsets can still need long labels, as panel d shows. The engine thins labels to fit. Authors can plot a meaningful relative quantity and state its reference in the axis label when a shorter representation is appropriate; automatic additive-offset notation is not introduced here.
Reproduce the review
python examples/plot_quality_review.py --output out/plot-quality
The command writes SVG, PNG and an external caption using scientific.general
and shared measured margins. PNG export requires the optional render extra.
Tick formatting does not change the coordinates or supplied uncertainty.
The new distribution and interval guide demonstrates physical caps and center markers, shared facet scales and explicit populations. The axes guide covers custom tick formats and typography.