

On this page
Historical material
This page preserves an earlier release or study. See the current guide for supported behavior.
Plot rendering review
Inklet 3.1 adds optional vector-line reduction with a physical error tolerance and measures explicit axis typography before layout. It also lets gridlines use the same tick-selection options as their axes.
Full-size figure · Executable recipe · LaTeX caption

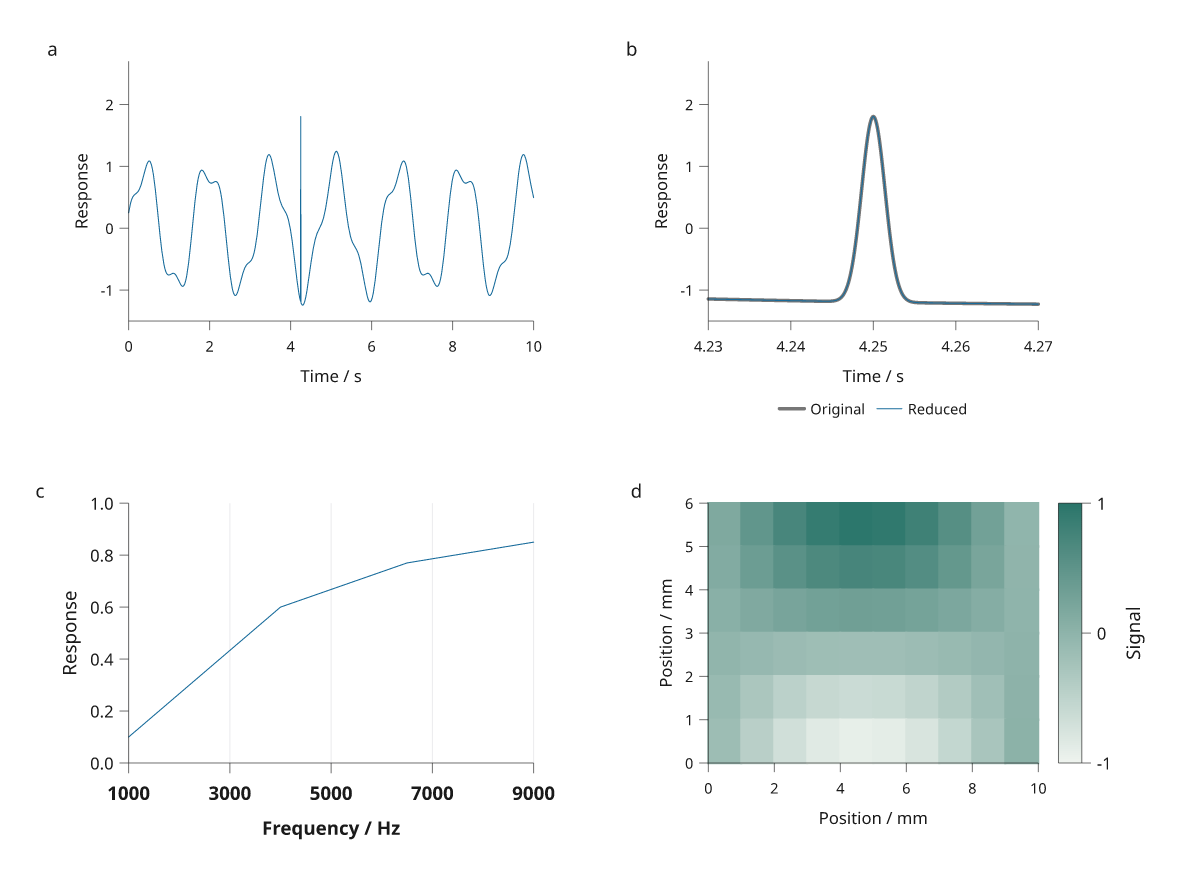
All data are simulated. The figure uses panel letters and axis labels, with its explanation in a separate caption. It does not infer statistical quantities.
Reproduce the figure
These features are included in Inklet 3.1. Check out v3.1.0 to reproduce this recipe.
git clone --branch v3.1.0 https://github.com/Mapika/inklet.git
cd inklet
python -m pip install -e '.[render]'
python examples/plot_engine_review.py
The output directory out/plot-engine-review/ contains SVG, PDF, PNG, captions
and a diagnostic report with the reduction's input and output vertex counts.
The recipe rejects diagnostic errors and warnings.
Dense vector lines
line(..., simplify=0.02) applies a 0.02 mm tolerance in mapped plot coordinates.
It retains endpoints and global extrema, recomputes when a live plot is resized,
and records its tolerance and point counts in diagram notes. The input dataset
is unchanged. The enlarged peak in panel b is reduced again at that panel's
scale, rather than enlarging a previously reduced drawing.
Reduction is optional. It may remove sub-tolerance details and change dash phase; curved and closed paths are unsupported. A work limit retains additional points on difficult paths instead of weakening the error bound. See Dense data for usage and limitations.
Measurements
The benchmark tool builds a 100,001-point signal
and exports SVG and PDF in fresh Python processes. Values are medians of three
runs on the same Linux/WSL2 workstation with Python 3.12.3; imports
and input preparation are excluded. The old checkout is cf73d63.
| Measurement | Previous exact | Current exact | Current reduced |
|---|---|---|---|
| Compile | 1.691 s | 1.711 s | 1.278 s |
| First SVG export | 0.156 s | 0.159 s | 0.093 s |
| First PDF export | 0.274 s | 0.271 s | 0.010 s |
| Compile + both exports | 2.116 s | 2.147 s | 1.382 s |
| SVG size | 980,481 bytes | 980,481 bytes | 27,002 bytes |
| PDF size | 461,067 bytes | 461,067 bytes | 6,491 bytes |
| Line vertices | 100,001 | 100,001 | 347 |
At 0.02 mm tolerance, the complete build and two exports were 1.55× faster than the current exact mode. SVG size fell 97.2% and PDF size 98.6%. Exact-mode export sizes match the previous engine. These results describe this smooth signal with a narrow peak. No reduction or speedup is guaranteed for noisy or complex paths.
Previous measurements · Current measurements
python tools/benchmark_lines.py --repeat 3 --output out/lines-after.json
python tools/benchmark_lines.py --source /path/to/previous-checkout \
  --mode exact --repeat 3 --output out/lines-before.json
Axis typography before and after
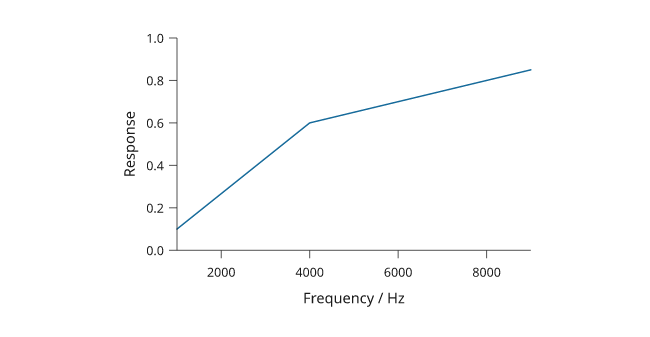
Both images use the same request for 11 pt bold axis text. The previous engine
(commit cf73d63) keeps its smaller default measurement; the current engine
measures the requested text before deciding which ticks fit.
Previous:
Current:
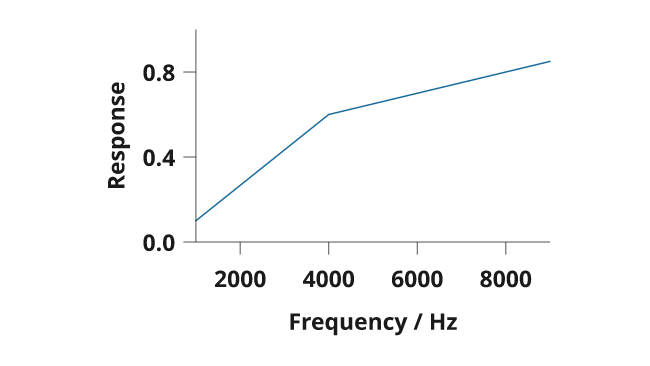
Use python examples/plot_engine_review.py --axes-only to reproduce the specimen.
For the old engine, set PYTHONPATH to that checkout's src directory.
Explicit font family, weight, italic style and size now participate in measuring
and thinning tick labels. tick_font_size and label_font_size control those
roles independently, including colorbars. font_size sets the base text and
spacing size. Prebuilt label diagrams retain their own typography.
Pass corresponding tick options through grid(x_options=..., y_options=...)
to match an axis's custom selection. Axes, scales and text
contains a complete example.
Checks
Geometric tests compare every removed vertex with its replacement segment and check endpoints, extrema, log-scale mapping and deterministic output. Other regressions check measured font faces, label clearance, grid alignment and colorbar sizes. SVG and PDF review remains part of the complete-figure tests.