

On this page
Polar and directional plots
Polar plots use angle and radius instead of Cartesian x and y. Angles are
degrees by default; zero and winding make the orientation explicit. These
examples use the direct polar panel, which can be placed in a document as
p.build(). See the complete tuning example for an
explanation of circular and axial summaries.
All values below are illustrative. Each snippet can be run independently with
core Inklet; PNG preview generation additionally uses the render extra.
Polar curves
Show a response as a function of angle.
The band contains supplied absolute radial bounds; the curve and observations
share the same angle/radius mapping. closed=True joins the final sample back
to the first around the circle.
Closed curves complete the turn in sample order. Use closed=False for partial
curves, and unwrap interior angles when the data crosses the 0°/360° seam.
Small white backgrounds behind radial tick labels keep them readable over the
grid and data; r_axis(..., plate=False) removes those backgrounds.
import inklet as i
import math
angles = list(range(0, 360, 30))
values = [3 + 1.4 * math.cos(math.radians(a - 60)) for a in angles]
p = i.polar(24, r=(0, 6), zero='up', winding='cw')
p.grid(r_count=3, theta_count=8)
p.band(angles, [v - .4 for v in values], [v + .4 for v in values],
       closed=True, fill='#bfd6cc', stroke='none')
p.line(list(zip(angles, values)), closed=True, stroke='#34735f')
p.scatter(list(zip(angles, values)), size=1.2, color='#34735f')
p.theta_axis(count=8)
p.r_axis(at=225, count=3)
fig = i.figure(width=80)
fig.add(p.build())
fig.save('polar-curve.svg', 'polar-curve.pdf')
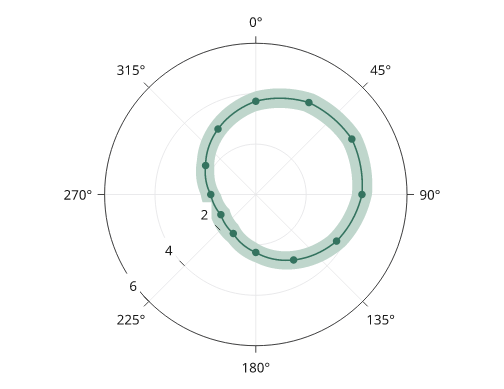
Rendered from the code above.
Rose plots
A rose draws radial bars at supplied angles. Heights are radii, so wedge area grows nonlinearly with the value. The optional mean vector below is the count-weighted circular mean of the bin centres; its length represents resultant concentration, not a mean count.
import inklet as i
angles, counts = list(range(0, 360, 45)), [3, 6, 8, 5, 2, 1, 2, 4]
p = i.polar(24, r=(0, 10), zero='up', winding='cw')
p.grid(r_count=2, theta_count=8)
p.rose(counts, at=angles, width=.85, color='#527da8')
p.mean_vector(angles, counts, stroke='#a64736', stroke_width=.6)
p.theta_axis(count=8)
p.r_axis(at=225, count=2)
fig = i.figure(width=80)
fig.add(p.build())
fig.save('rose.svg', 'rose.pdf')
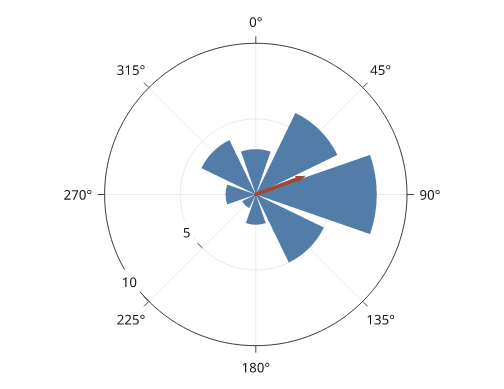
Rendered from the code above.
Radar charts
A radar chart places one spoke per category, equally spaced round the turn,
and draws each series as a closed polygon through its value on each spoke.
radar_grid draws the rings, the spokes and the category names.
Rings are polygons by default; shape='circle' draws circles. The panel's
theta domain must be a whole turn.
import inklet as i
axes = ['Speed', 'Accuracy', 'Recall', 'Depth', 'Range', 'Stability']
p = i.polar(18, r=(0, 1), zero='up', winding='cw')
p.radar_grid(axes)
p.radar([.8, .6, .9, .4, .7, .5], name='Model A', color='#24698c')
p.radar([.5, .9, .6, .8, .4, .7], name='Model B', color='#b86443')
p.legend(side='bottom')
fig = i.figure(width=80)
fig.add(p.build())
fig.save('radar.svg', 'radar.pdf')
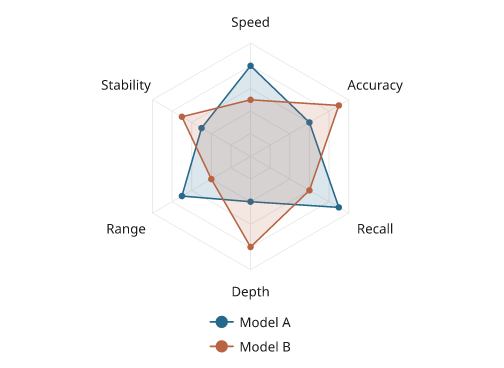
Illustrative scores between 0 and 1. The rings are at 0.2 steps.
radar_grid(values=True) writes ring values up one gap between two spokes,
on a paper halo. They are placed when the panel is built, in the gap where
the most values keep clear of every series' lines and dots; a value that
would touch the data is left out. On a crowded chart only one or two values
may fit, so they are off by default; the caption can state the ring steps
instead.
Pie and donut charts
pie divides the turn in proportion to the values, starting at the start
of the theta domain and following the panel's winding. A panel made with
hole= draws a donut. Each label is set inside its slice when it fits and
outside the rim when it does not. labels= takes 'percent' (default),
'value', None, a format such as '{share:.1%}', a function of
(value, share) or one string per slice.
import inklet as i
pie = i.polar(14, zero='up', winding='cw')
pie.pie([54, 28, 12, 4, 2],
        color=['#24698c', '#288675', '#b86443', '#e6b93f', '#b9b8b4'],
        name=['Neurons', 'Glia', 'Vascular', 'Immune', 'Other'])
pie.legend(side='right')
donut = i.polar(14, hole=7, zero='up', winding='cw')
donut.pie([61, 39], color=['#668fb8', '#e6b93f'])
fig = i.figure(width=120)
fig.add(i.row([pie.build(), donut.build()]))
fig.save('pie.svg', 'pie.pdf')
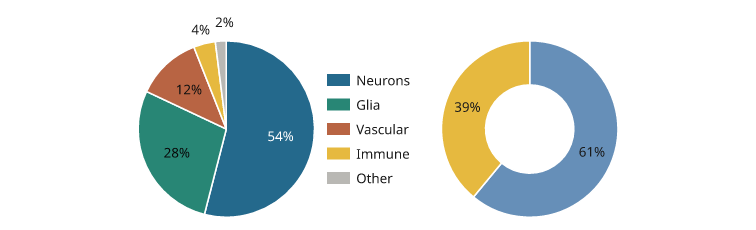
Illustrative shares. The two smallest slices are labelled outside the rim.
An outside label that would overlap another moves out or round the rim to
the nearest clear spot. A label that ends up away from its slice gets a
hairline leader back to the rim; the pie_labels note lists those slices
under leaders.
Pie breakout bars
breakout expands one slice, or several adjacent slices, of the pie into a
stacked bar beside the disc. Two connector lines run from the rim at the
slices' outer edges to the top and bottom of the bar. Without parts, the
bar shows the chosen slices as shares of their sum, in their own colours.
With parts, it shows the composition of the slice: those values, in
color= or in shades of the slice colour. Each part is labelled with its
share of the bar; labels that would overlap are moved apart.
Call breakout after pie. The pie turns so the middle of the chosen
slices faces the bar, with the first slice uppermost. A zero or winding
given to i.polar is kept, so i.polar(11, zero='up', winding='cw') draws
the pie as given; then put the chosen slices on the side that faces the bar,
or the connectors cross the pie. The pie turns only when nothing else is
drawn on the panel before breakout.
Pie labels set outside the rim move out or round the rim, on a leader when
they leave their slice, to keep clear of the connectors and the bar. A label that cannot is listed under
crossing in the pie's pie_labels note; leave it out (labels= with
None for that slice) or pass zero=.
A theta_axis on the panel, drawn before or after breakout, keeps its
angle labels off the connectors, the bar and the title. A label that touches
one is nudged a little along the rim or outward, or dropped when no nudge
clears it; a curved label is dropped. The axis's theta_axis note lists the
labels nudged and dropped, as does axis_labels in the pie_breakout
note.
import inklet as i
ink, yellow, grey = '#262626', '#e6b93f', '#e4e4e4'
share = i.polar(11)
share.pie([24.8, 1.5, 73.7], color=[ink, yellow, grey],
          labels=['24.8%', None, '73.7%'],
          name=['Isomorphic', 'Dimorphic', 'Noise'])
share.breakout([0, 1], labels='{share:.1%}', title='Without noise')
share.legend(side='bottom')
parts = i.polar(11, hole=5.5)
parts.pie([31, 44, 25], color=['#24698c', '#b9b8b4', '#d9d8d4'])
parts.breakout(0, [58, 27, 10, 5], name=['Type 1', 'Type 2', 'Type 3', 'Type 4'])
parts.legend(side='bottom')
fig = i.figure(width=120)
fig.add(i.row([share.build(), parts.build()], gap=8, align='top'))
fig.save('breakout.svg', 'breakout.pdf')
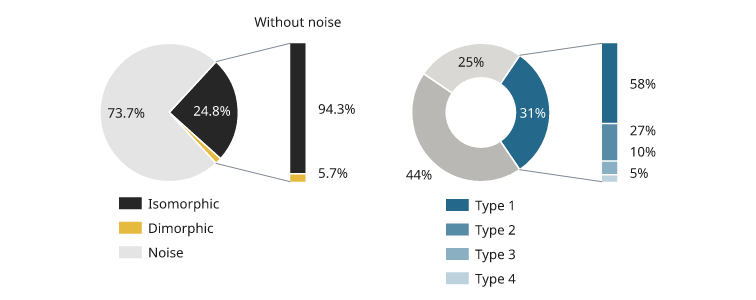
Illustrative shares. Left: the isomorphic and dimorphic slices as shares of their sum. Right: one donut slice divided into four parts.
Next steps
Compare plot types, configure axes and scales, or arrange several panels. For exact options, see the API.