

On this page
Published figures, recreated
Fourteen well-known figures from a dozen fields, and ten figures from six
landmark open-access Nature papers, rebuilt in Inklet from the data behind
them. Each lives in examples/published/ with its
data, a SOURCE.md (full citation, data URL, licence, retrieval date and any
processing) and a NOTES.md that says what matches the original and what
differs. Every script reports no lint warnings.
Original figure images are not reproduced here; follow the citations to see them. Where a published figure needed data that is not public, the notes say what was left out.
Landmark Nature papers: faithful and improved
Six papers from Nature and Nature Physics, all published under CC BY 4.0 with the numbers behind their figures released. Each figure is drawn twice:
- Faithful (
figN.py): the original's print width (measured from its type), layout, colours, ranges and frame. Physics figures use the journal frame,i.preset("scientific.nature", axes="box"): a black box with inward major and minor ticks. - Improved (
figN_improved.py): the same data and every uncertainty, with the original's weak points fixed: colour-blind-safe colours, direct labels instead of distant keys, less overplotting, better scales. Explanations stay out of the figure; eachNOTES.mdhas a suggested Nature legend instead.
JWST: carbon dioxide in an exoplanet atmosphere

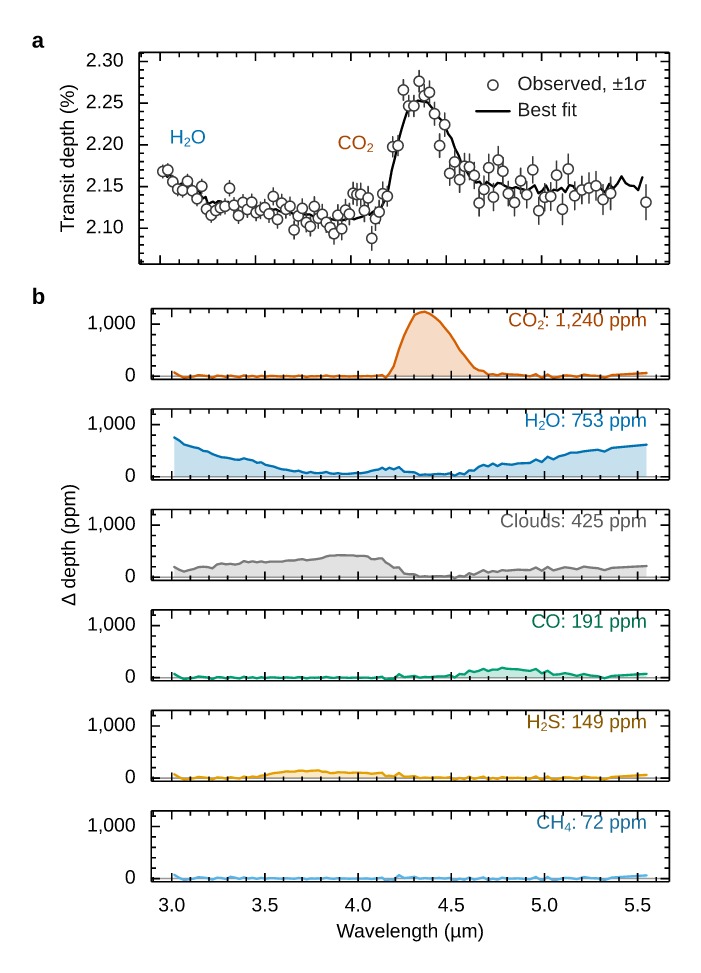
JWST Transiting Exoplanet Community ERS Team, "Identification of carbon dioxide
in an exoplanet atmosphere", Nature 614, 649–652 (2023),
doi:10.1038/s41586-022-05269-w, Fig. 3.
The authors released the spectrum and models but not the bottom panel's
cross-sections, so those are computed from HITRAN line lists
(cross_sections.py).
The improved version replaces seven overlapping model curves with one strip per
gas, on a shared scale, showing how much each adds to the spectrum.
Faithful ·
improved ·
notes
ATLAS: the Higgs boson's couplings, ten years on

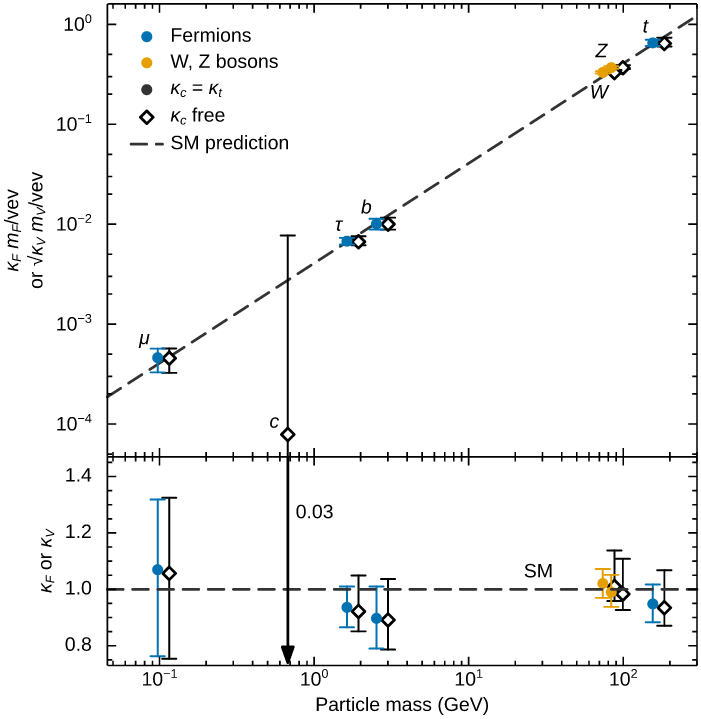
ATLAS Collaboration, "A detailed map of Higgs boson interactions by the ATLAS experiment ten years after the discovery", Nature 607, 52–59 (2022), doi:10.1038/s41586-022-04893-w, Fig. 5. Data: HEPData record ins2104706. The improved version separates the two fit scenarios by marker shape as well as colour and labels every particle at its point. Faithful · improved · notes
KATRIN: neutrino mass below one electronvolt


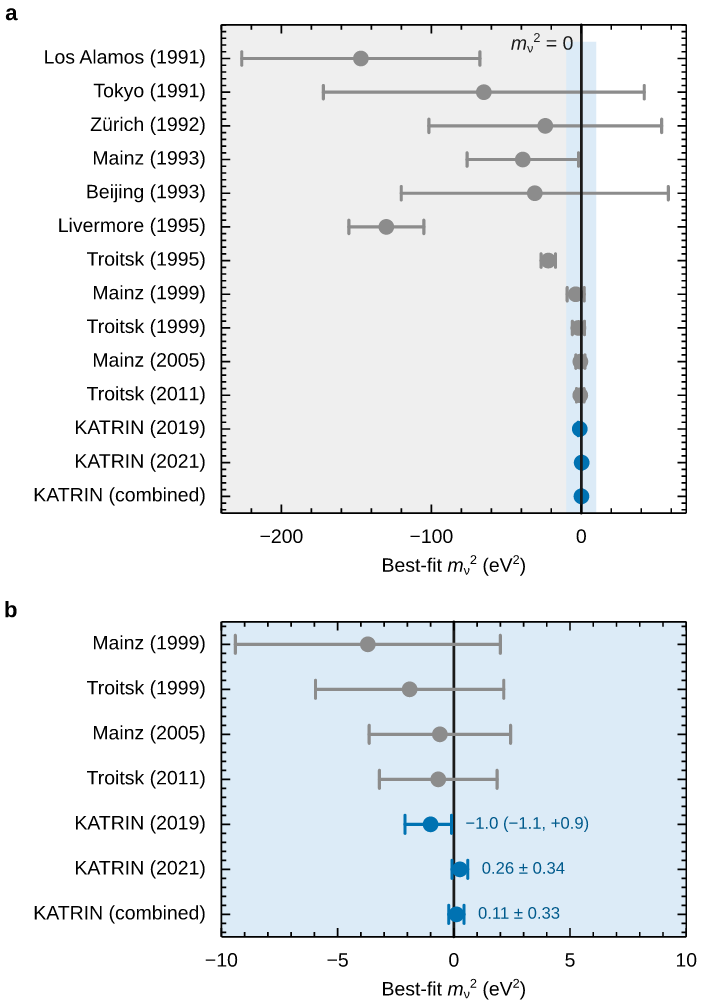
KATRIN Collaboration, "Direct neutrino-mass measurement with sub-electronvolt
sensitivity", Nature Physics 18, 160–166 (2022),
doi:10.1038/s41567-021-01463-1, Figs 3 and 4.
The contours are the histogram's highest-density regions, drawn with
Panel.contour(..., hdr=(0.683, 0.954)). In the improved Fig. 4, the
early results' errors of hundreds of eV² no longer squash KATRIN's ±0.3 eV²
into a sliver.
Fig. 3 ·
Fig. 3 improved ·
Fig. 4 ·
Fig. 4 improved ·
notes
Human height: a saturated map of common variants

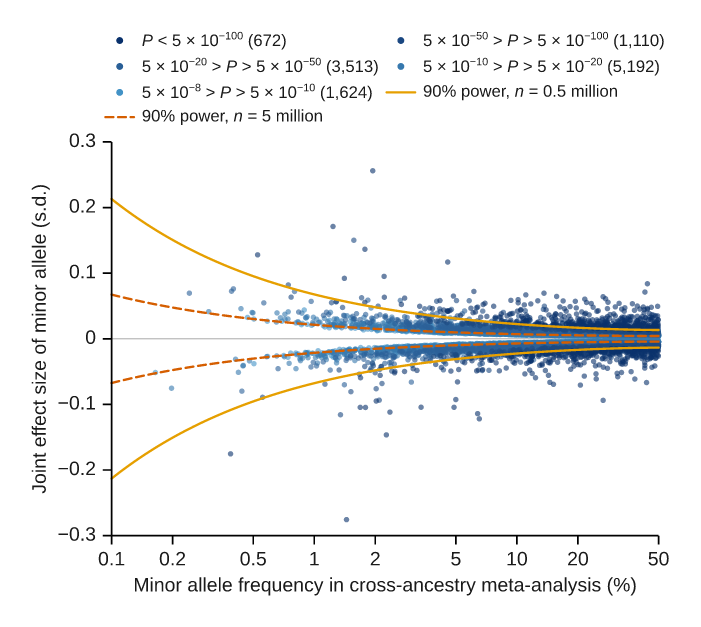
L. Yengo et al., "A saturated map of common genetic variants associated with human height", Nature 610, 704–712 (2022), doi:10.1038/s41586-022-05275-y, Figs 1 and 2. The improved Fig. 1 puts allele frequency on a log axis, where the rare variants crowded against the left edge of the original spread out, and colours the ordered P-value classes with an ordered ramp. Fig. 1 · Fig. 1 improved · Fig. 2 · notes
Brain-wide association studies need thousands of people

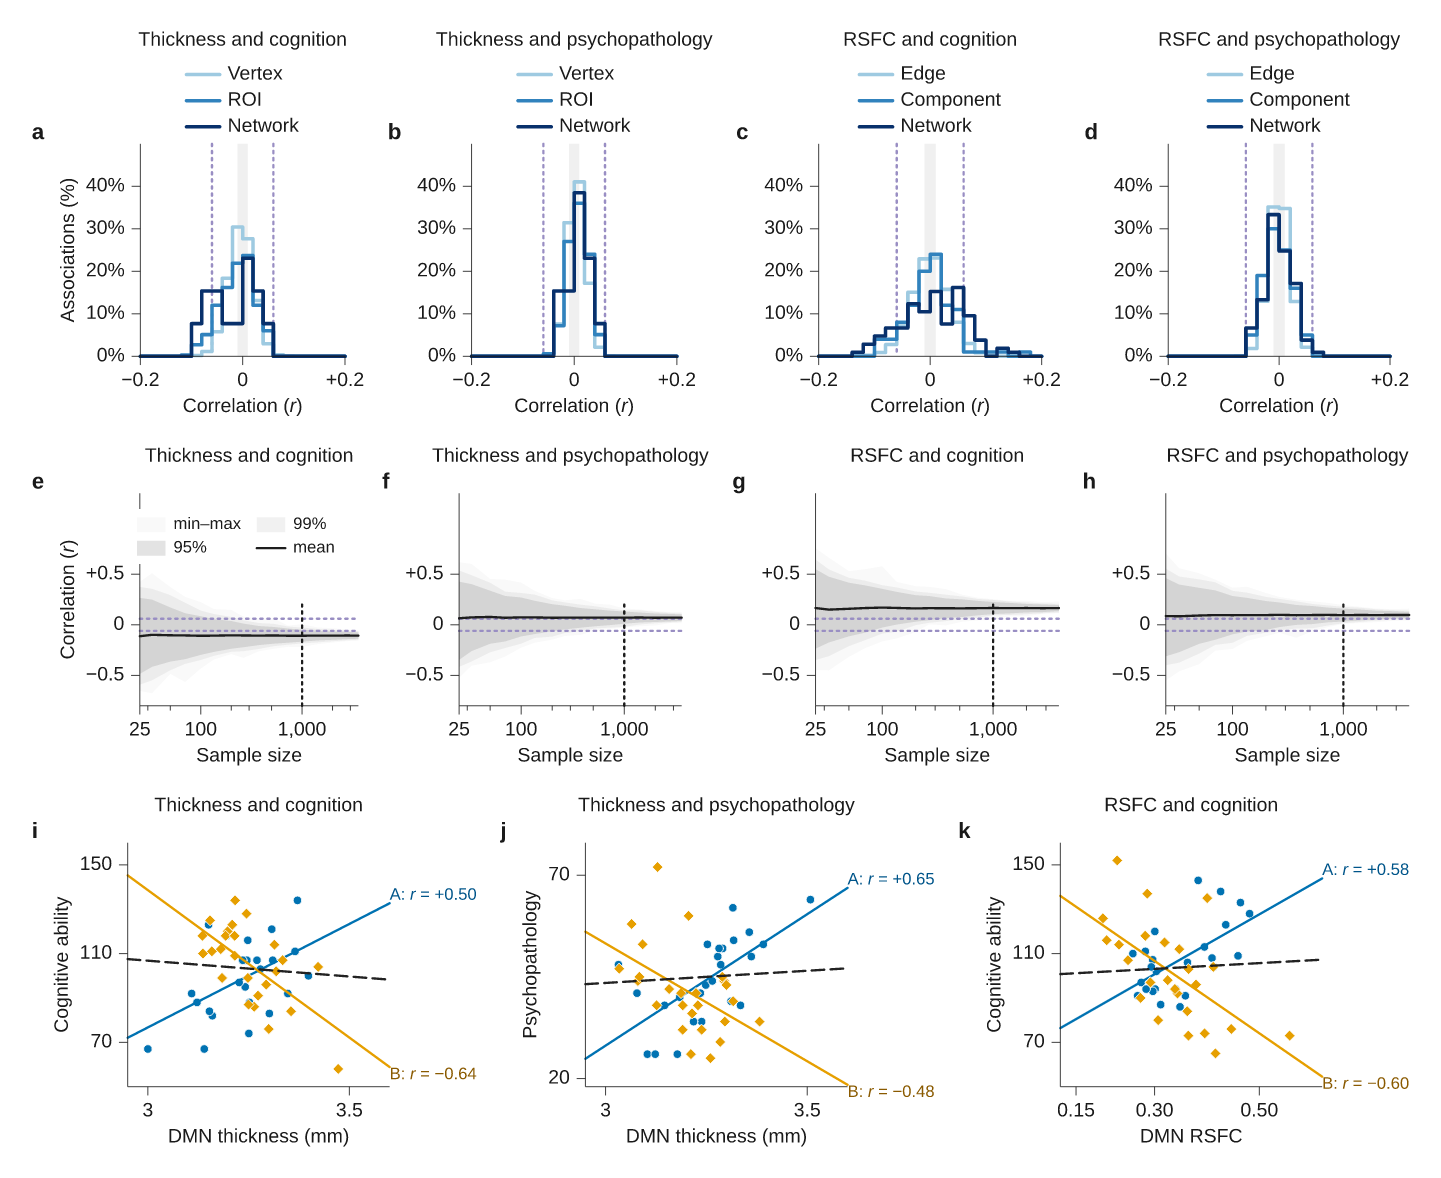
S. Marek et al., "Reproducible brain-wide association studies require thousands of individuals", Nature 603, 654–660 (2022), doi:10.1038/s41586-022-04492-9, Fig. 1 (panels a, b and e–h; the brain maps in c and d are not in the source data). Faithful · improved · notes
WHO: excess mortality during the COVID-19 pandemic


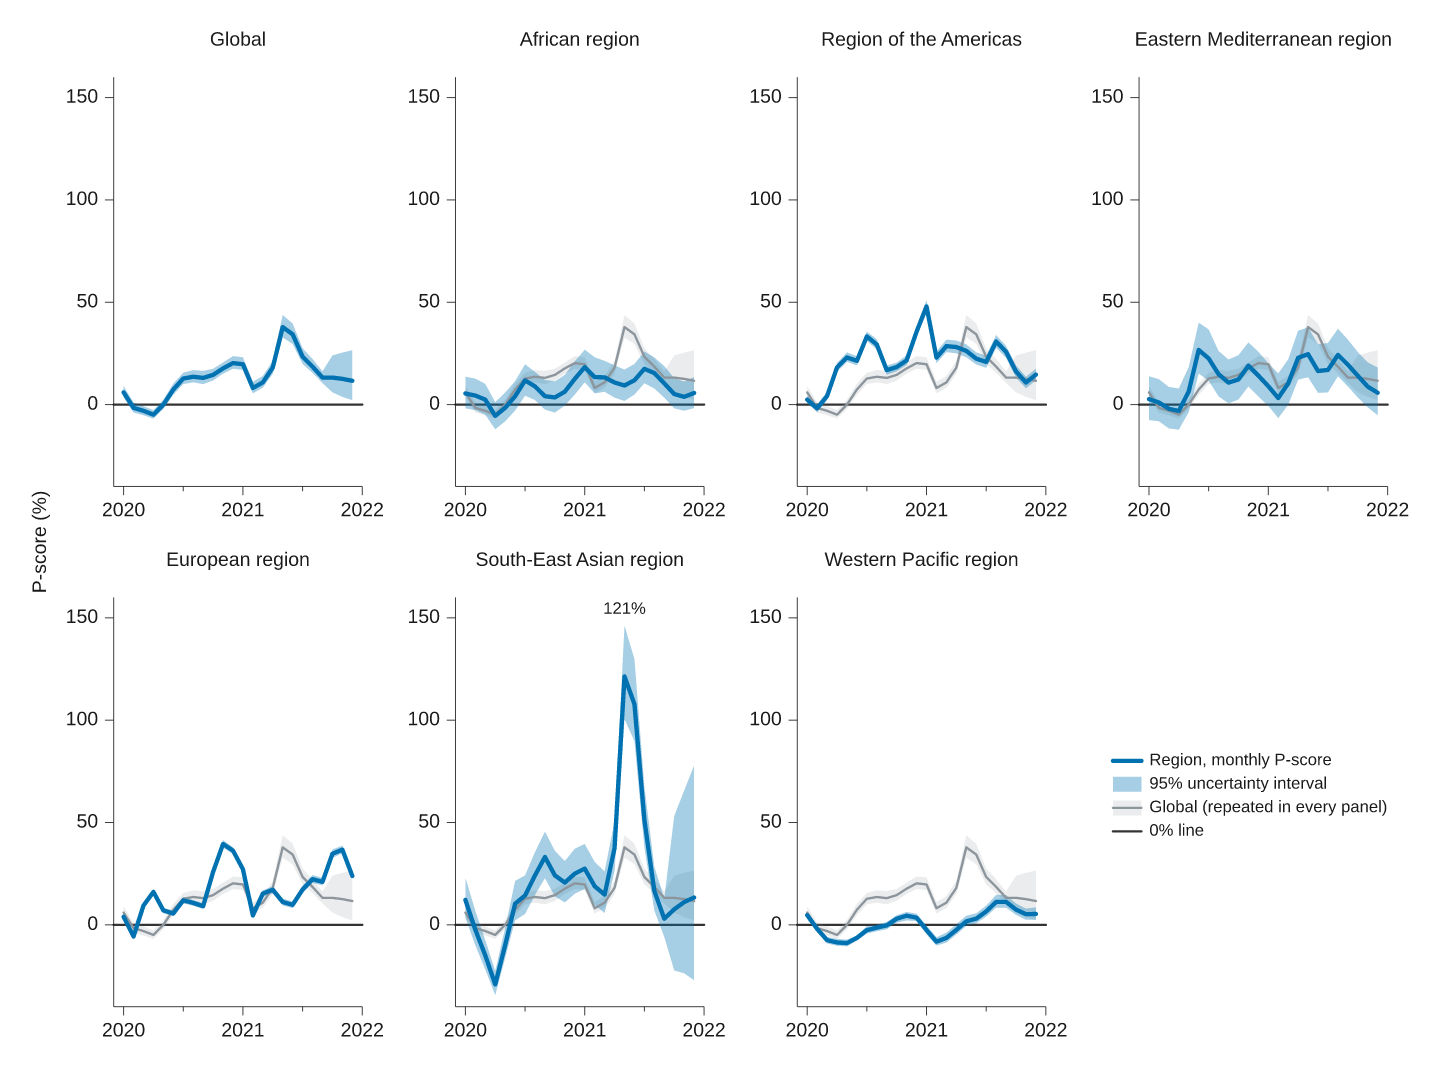
W. Msemburi et al., "The WHO estimates of excess mortality associated with the COVID-19 pandemic", Nature 613, 130–137 (2023), doi:10.1038/s41586-022-05522-2, Figs 1, 2 and 5. The improved Fig. 2 drops seven meaningless colours for one, and puts the global series behind every region so each can be read against it. Fig. 1 · Fig. 2 · Fig. 2 improved · Fig. 5 · notes
Classic figures
Fourteen well-known figures, restyled in Inklet's default look rather than copied pixel for pixel.
Physics: the first gravitational-wave detection
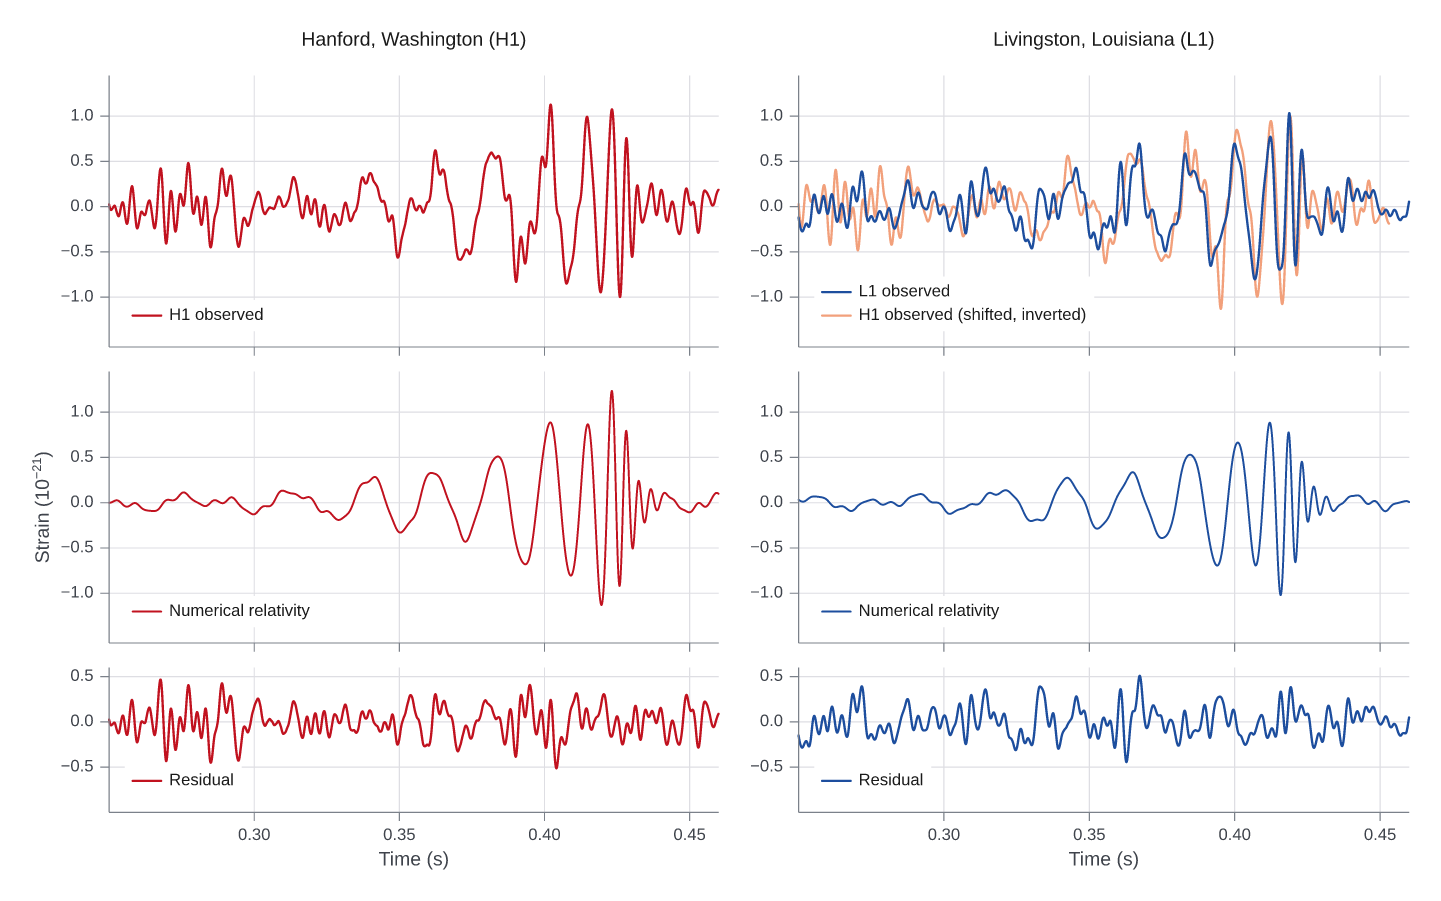
Abbott et al. (LIGO and Virgo Collaborations), "Observation of Gravitational Waves from a Binary Black Hole Merger", Phys. Rev. Lett. 116, 061102 (2016), doi:10.1103/PhysRevLett.116.061102, Figure 1. Data: the GWOSC Figure 1 release (CC BY 4.0), unmodified. The three strain rows are recreated; the spectrogram row and the 90% waveform bands are not published as data. Script · notes
Astronomy: Hubble's velocity–distance relation
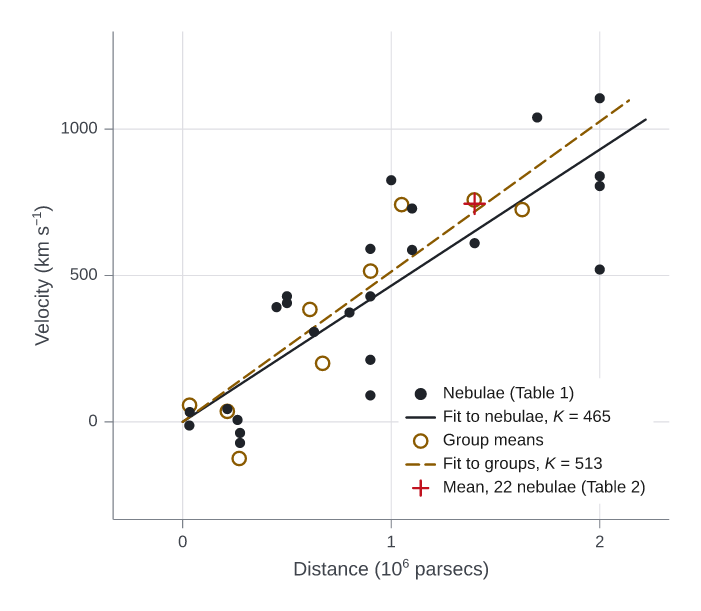
E. Hubble, "A relation between distance and radial velocity among extra-galactic nebulae", PNAS 15, 168–173 (1929), doi:10.1073/pnas.15.3.168, Figure 1. Data: Table 1 of the paper (public domain), with velocities corrected for solar motion using Hubble's own solution; the refit reproduces his K = 465 km/s/Mpc. Five of the nine group means are read from the printed figure. Script · notes
Climate: the Keeling curve
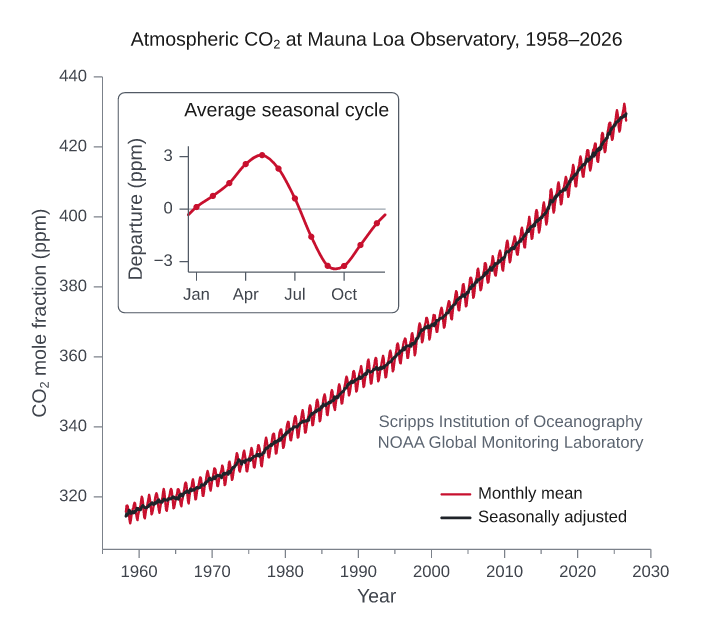
C. D. Keeling et al., "Atmospheric carbon dioxide variations at Mauna Loa Observatory, Hawaii", Tellus 28, 538–551 (1976), and the NOAA GML / Scripps record as published at gml.noaa.gov. Data: NOAA GML monthly means (public domain), March 1958 to August 2026. Script · notes
Ecology: Palmer penguins
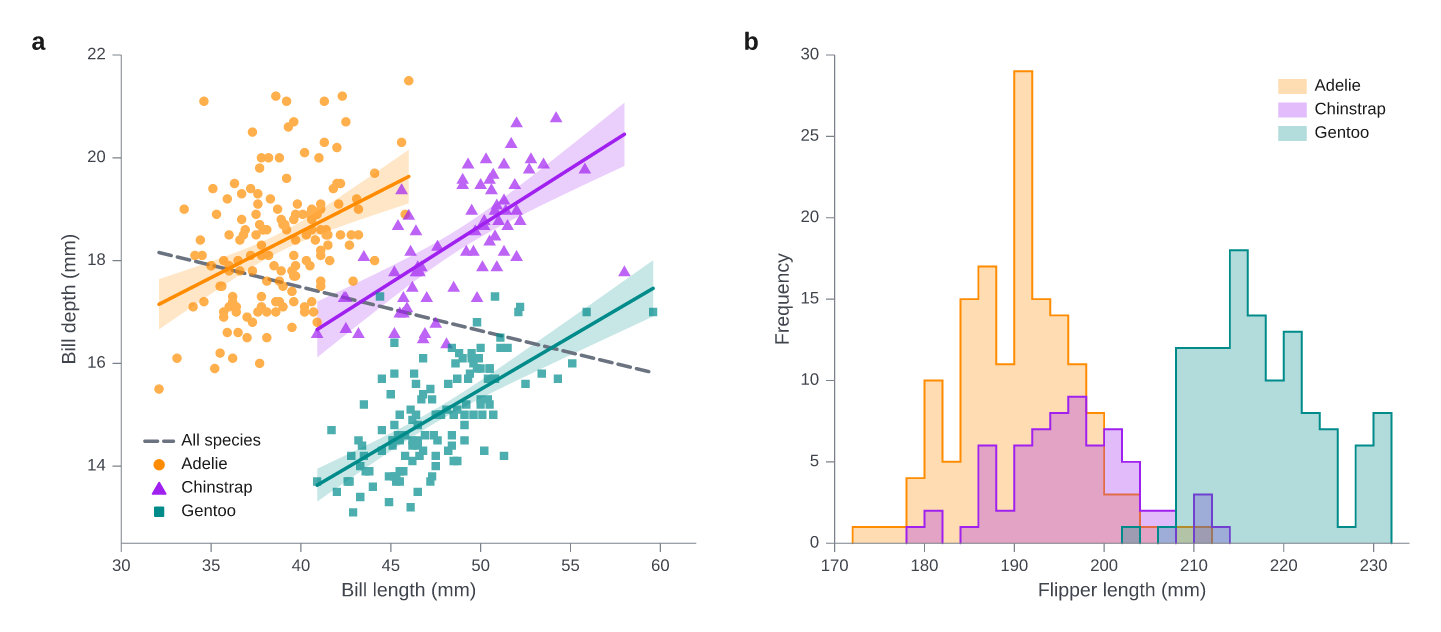
K. B. Gorman, T. D. Williams & W. R. Fraser, "Ecological sexual dimorphism and environmental variability within a community of Antarctic penguins (genus Pygoscelis)", PLoS ONE 9, e90081 (2014), doi:10.1371/journal.pone.0090081, as packaged and plotted by Horst, Hill & Gorman (palmerpenguins, CC0). Panel a shows Simpson's paradox: the pooled slope is negative, every species' slope positive. Script · notes
Medicine: survival in advanced lung cancer
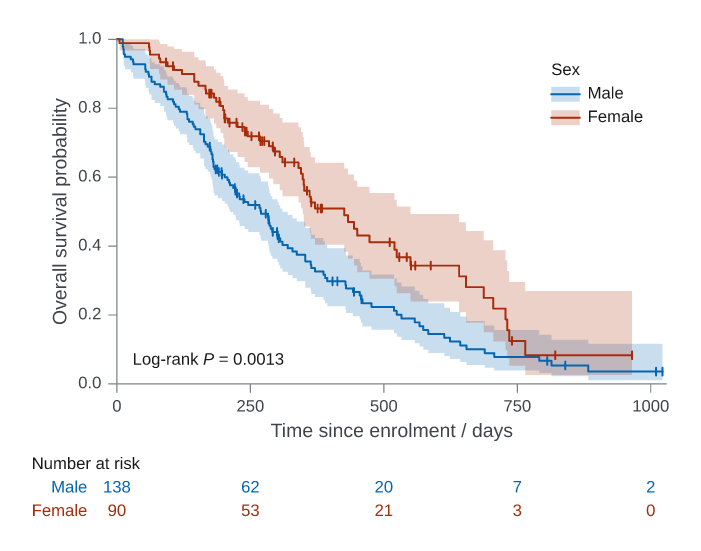
Loprinzi et al., "Prospective evaluation of prognostic variables from
patient-completed questionnaires", J. Clin. Oncol. 12, 601–607 (1994),
doi:10.1200/JCO.1994.12.3.601.
The trial's data are R's survival::lung; this Kaplan–Meier plot by sex is
their standard published presentation (R survival and survminer
documentation), not a figure printed in the paper. Medians, at-risk counts and
the log-rank P = 0.0013 match R.
Script ·
notes
Genomics: glucocorticoid response in airway smooth muscle
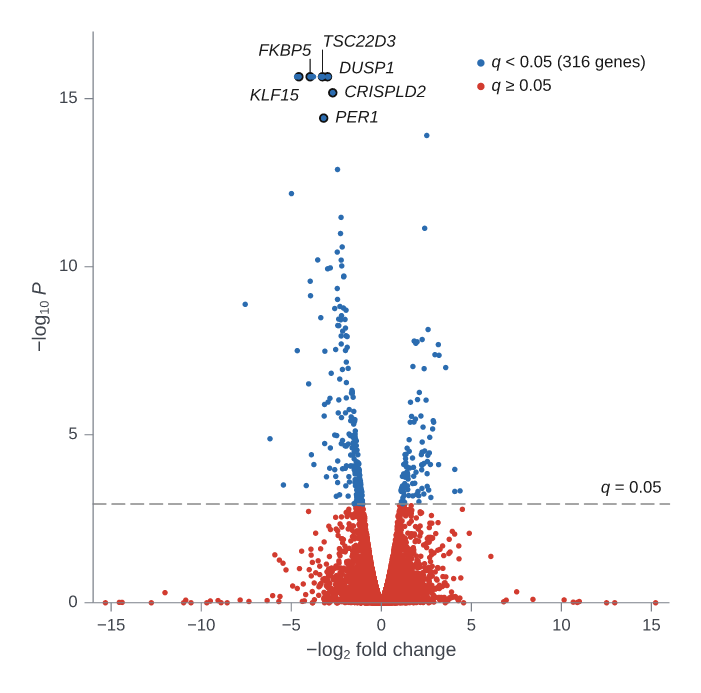
Himes et al., "RNA-Seq transcriptome profiling identifies CRISPLD2 as a glucocorticoid responsive gene that modulates cytokine function in airway smooth muscle cells", PLoS ONE 9, e99625 (2014), doi:10.1371/journal.pone.0099625, Figure 1A. Data: the authors' Cuffdiff results deposited with the paper (GEO GSE52778); 316 genes at q < 0.05, as in the caption. Gene labels are added. Script · notes
Development: health and wealth of nations
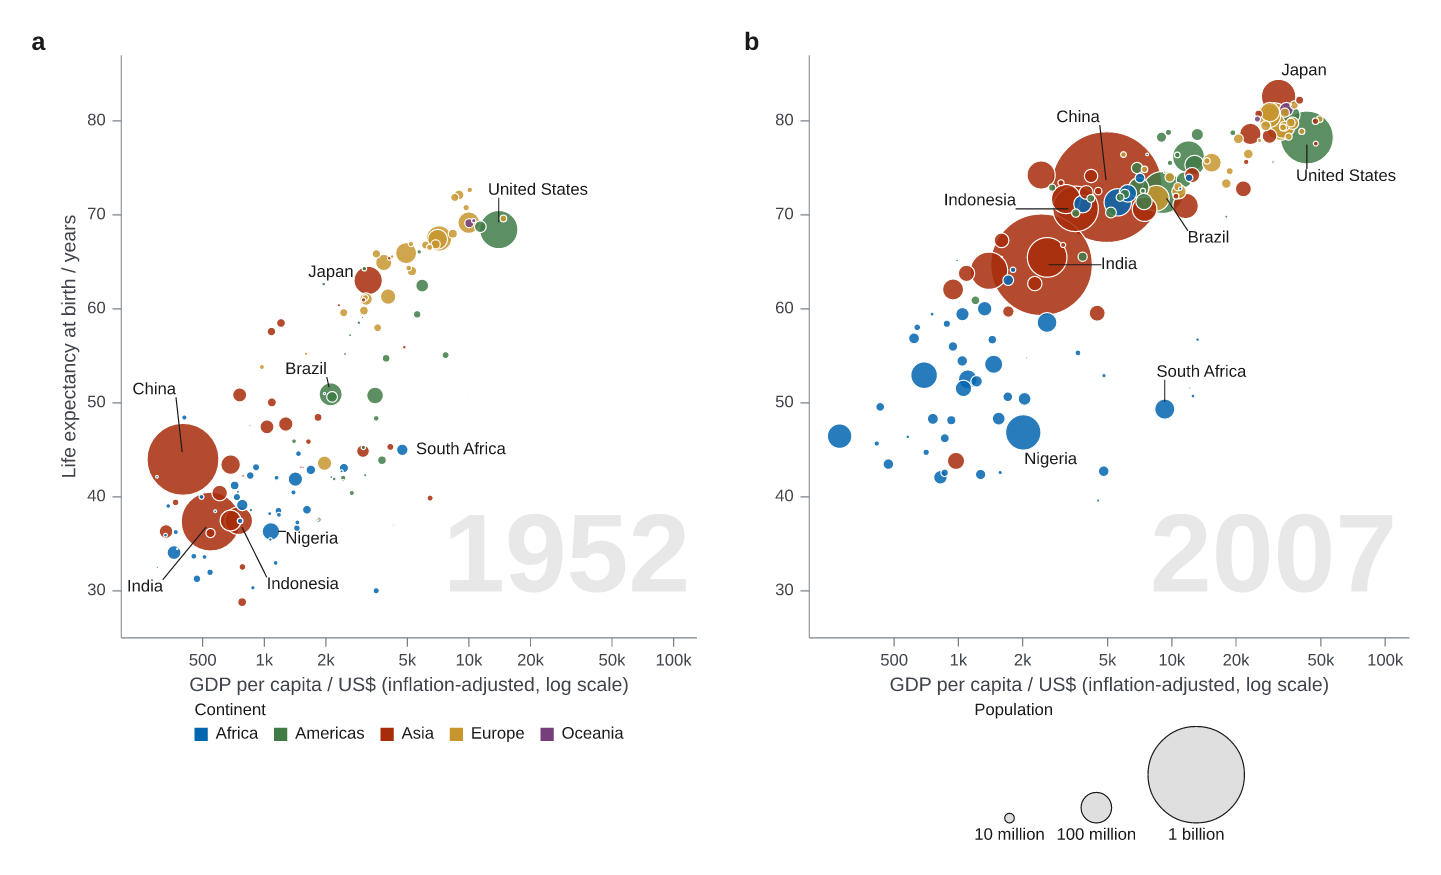
Hans Rosling's Gapminder chart (Gapminder Foundation; Rosling, Rosling &
Rosling Rönnlund, Factfulness, 2018), with the gapminder data excerpt
(CC0; Gapminder data CC BY 4.0). Bubble area is population; 1952 and 2007
share their axes. Script ·
notes
Statistics: Anscombe's quartet
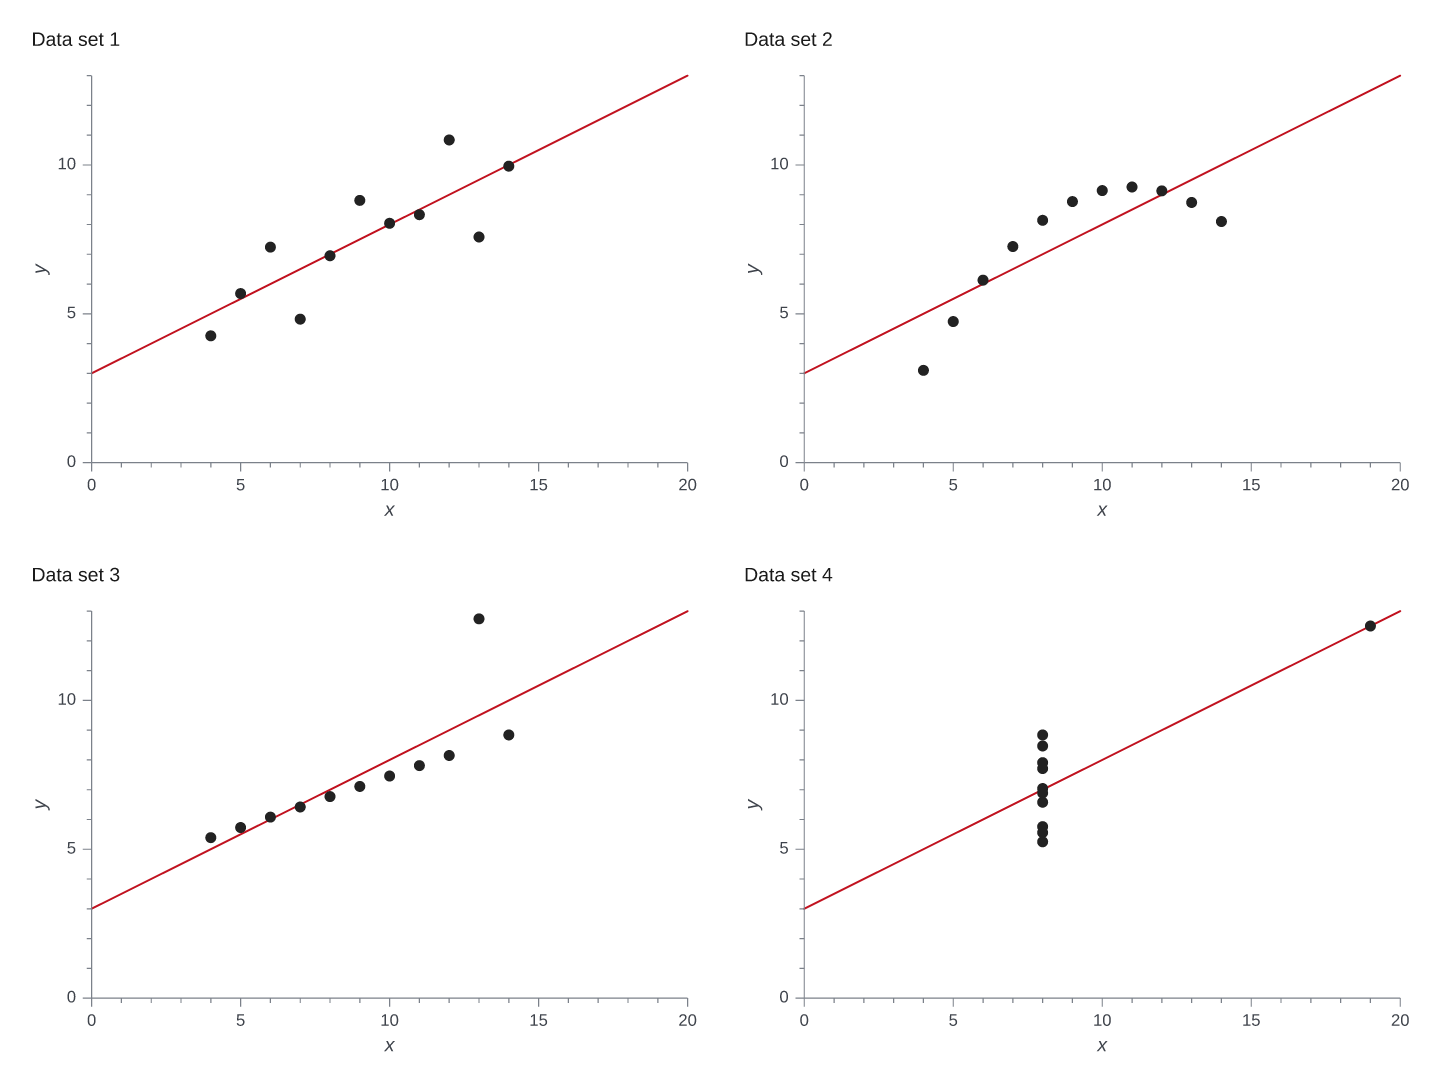
F. J. Anscombe, "Graphs in Statistical Analysis", The American Statistician 27, 17–21 (1973), doi:10.1080/00031305.1973.10478966, Figures 1–4. Data: the paper's table, checked value by value. Script · notes
Cosmology: the cosmic microwave background spectrum
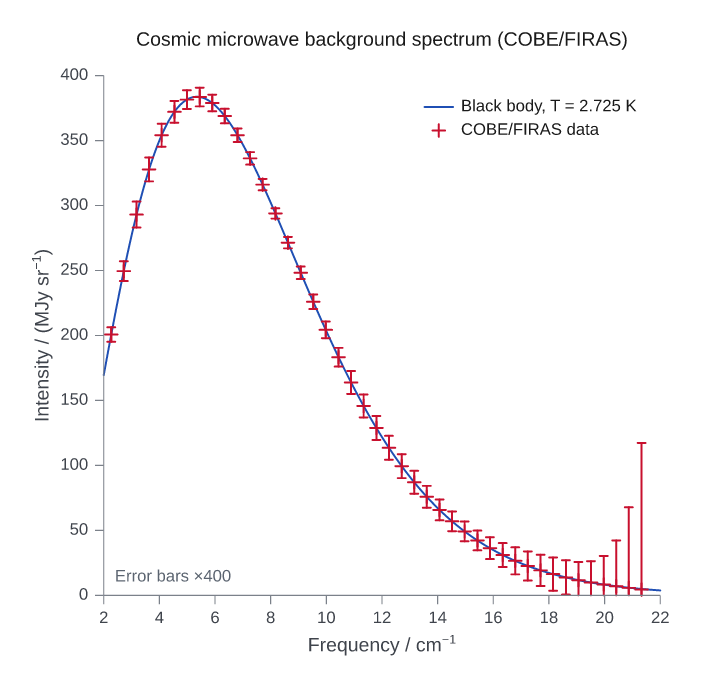
Mather et al., ApJ 420, 439 (1994), doi:10.1086/173574, and Fixsen et al., ApJ 473, 576 (1996), doi:10.1086/178173. Data: the FIRAS monopole spectrum from NASA LAMBDA (public domain); the blackbody is Planck's law at 2.725 K. Error bars are drawn at 400σ, as in the well-known version of the figure. Script · notes
Seismology: the Gutenberg–Richter law
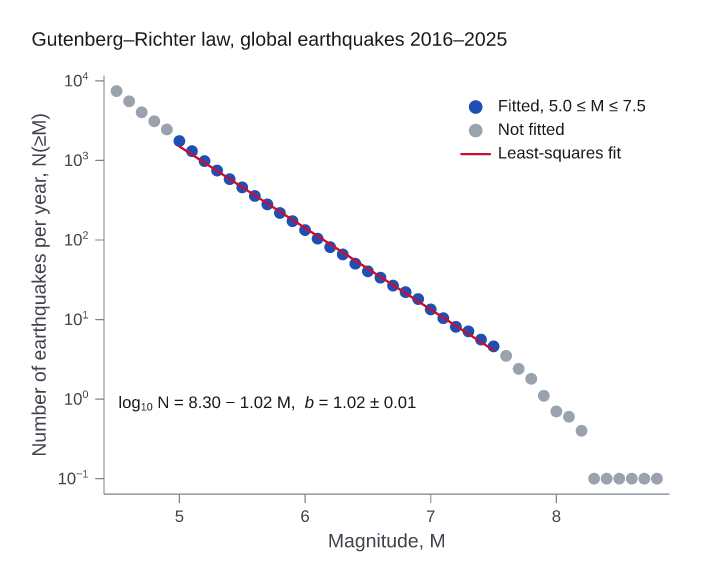
B. Gutenberg & C. F. Richter, "Frequency of earthquakes in California", BSSA 34, 185–188 (1944), doi:10.1785/BSSA0340040185. The 1944 paper has tables but no figure; this is the law's standard plot, built from the USGS global catalogue for 2016–2025 (public domain). The fit over 5.0 ≤ M ≤ 7.5 gives b = 1.02. Script · notes
Population ecology: hare and lynx cycles
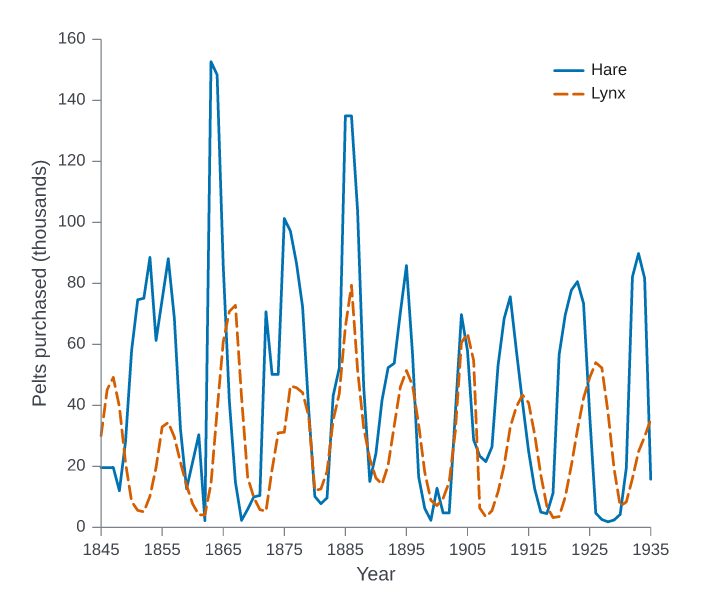
MacLulich (1937) and C. Elton & M. Nicholson, "The ten-year cycle in numbers of the lynx in Canada", J. Anim. Ecol. 11, 215–244 (1942), doi:10.2307/1358, as plotted in Odum's Fundamentals of Ecology. Data: the yearly pelt counts, checked against two independent transcriptions. Script · notes
Psychology: Ebbinghaus's forgetting curve
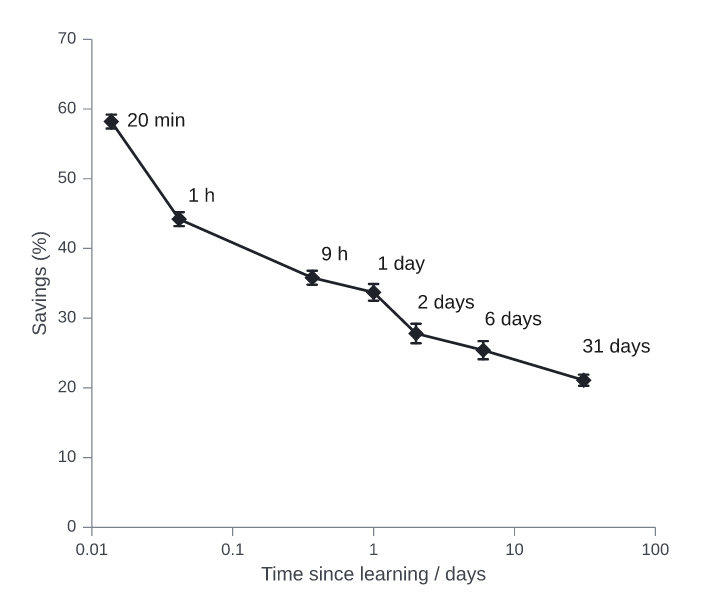
H. Ebbinghaus, Über das Gedächtnis (1885; English translation 1913), the savings table, checked against the German text and against Murre & Dros, PLoS ONE 10, e0120644 (2015), doi:10.1371/journal.pone.0120644. Script · notes
Epidemiology: John Snow's cholera map
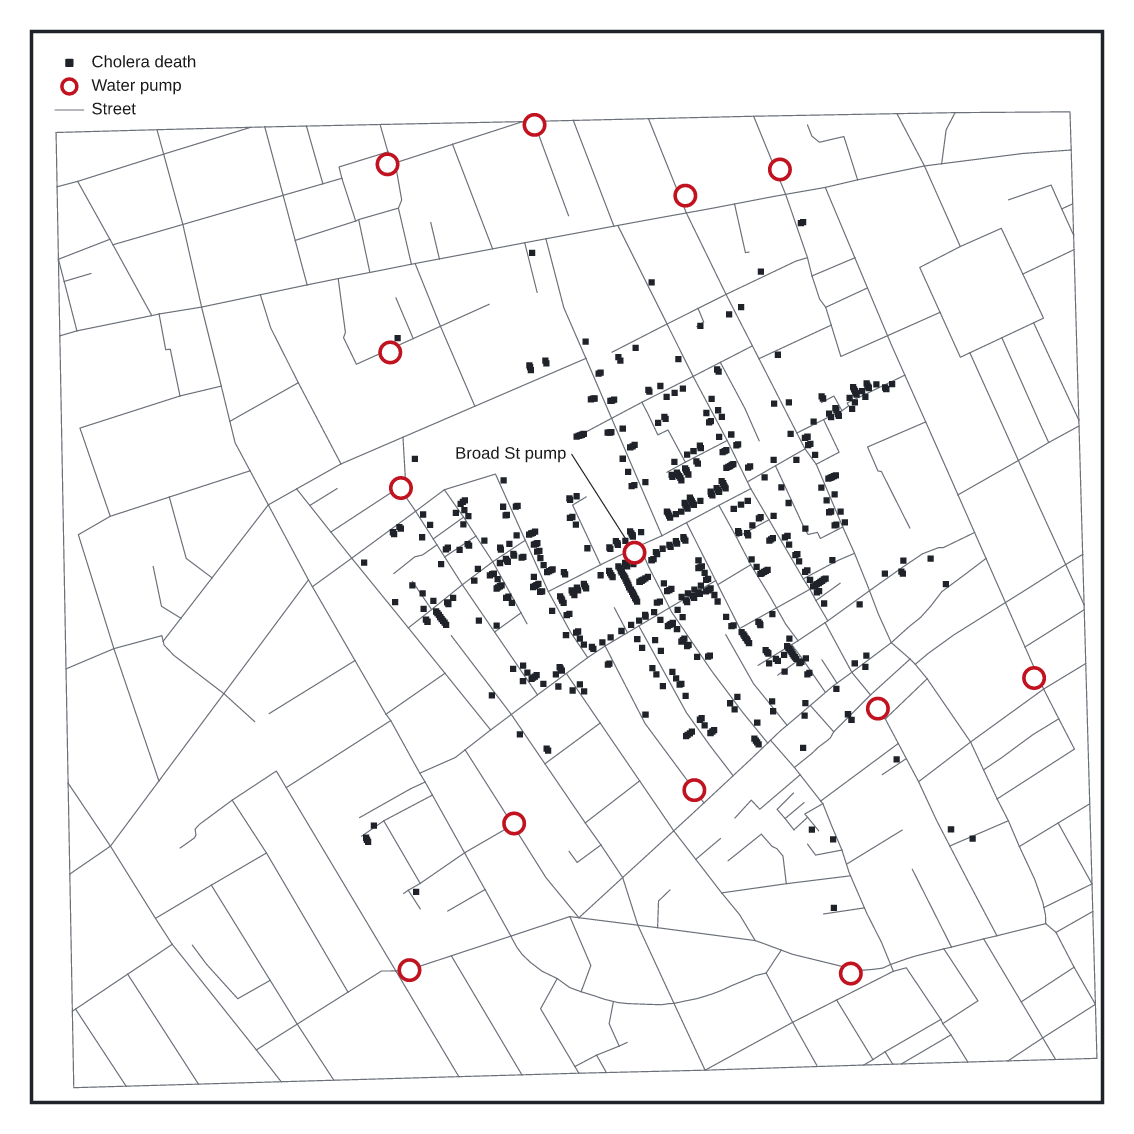
J. Snow, On the Mode of Communication of Cholera, 2nd ed. (1855), Map 1. Data: the digitization in the R package HistData (GPL; 578 deaths, 13 pumps), drawn at equal scale on both axes. Script · notes
Physiology: the Hodgkin–Huxley action potential
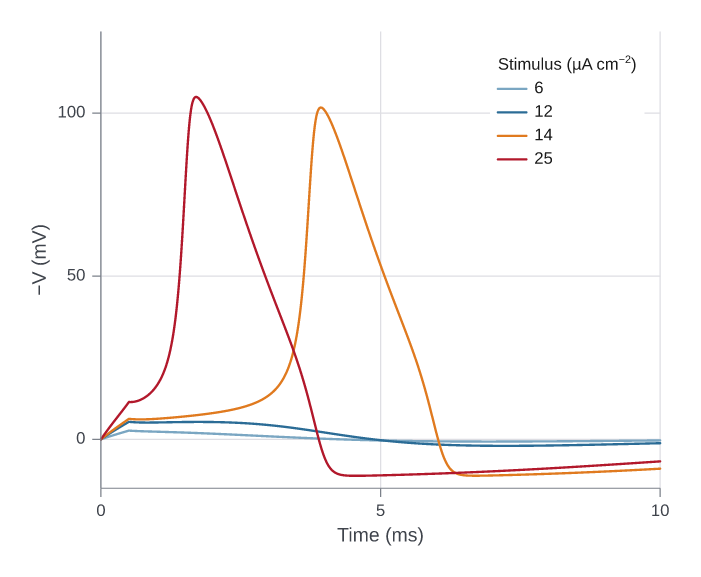
A. L. Hodgkin & A. F. Huxley, "A quantitative description of membrane current and its application to conduction and excitation in nerve", J. Physiol. 117, 500–544 (1952), doi:10.1113/jphysiol.1952.sp004764. Unlike the others, this figure is computed from the paper's equations and constants at 6.3 °C (RK4, 1 µs steps), in the paper's sign convention; it was not checked against the printed figure, which could not be accessed. Script · notes
Rebuild them
for script in examples/published/*/figure.py examples/published/*/fig*.py; do python "$script"; done
The scripts write to gallery/published/. They need pandas and NumPy for
reading the data files, and PyYAML for the ATLAS HEPData tables.