

On this page
Interference
Two radial waves, one shared colour scale. Inklet 3.0.
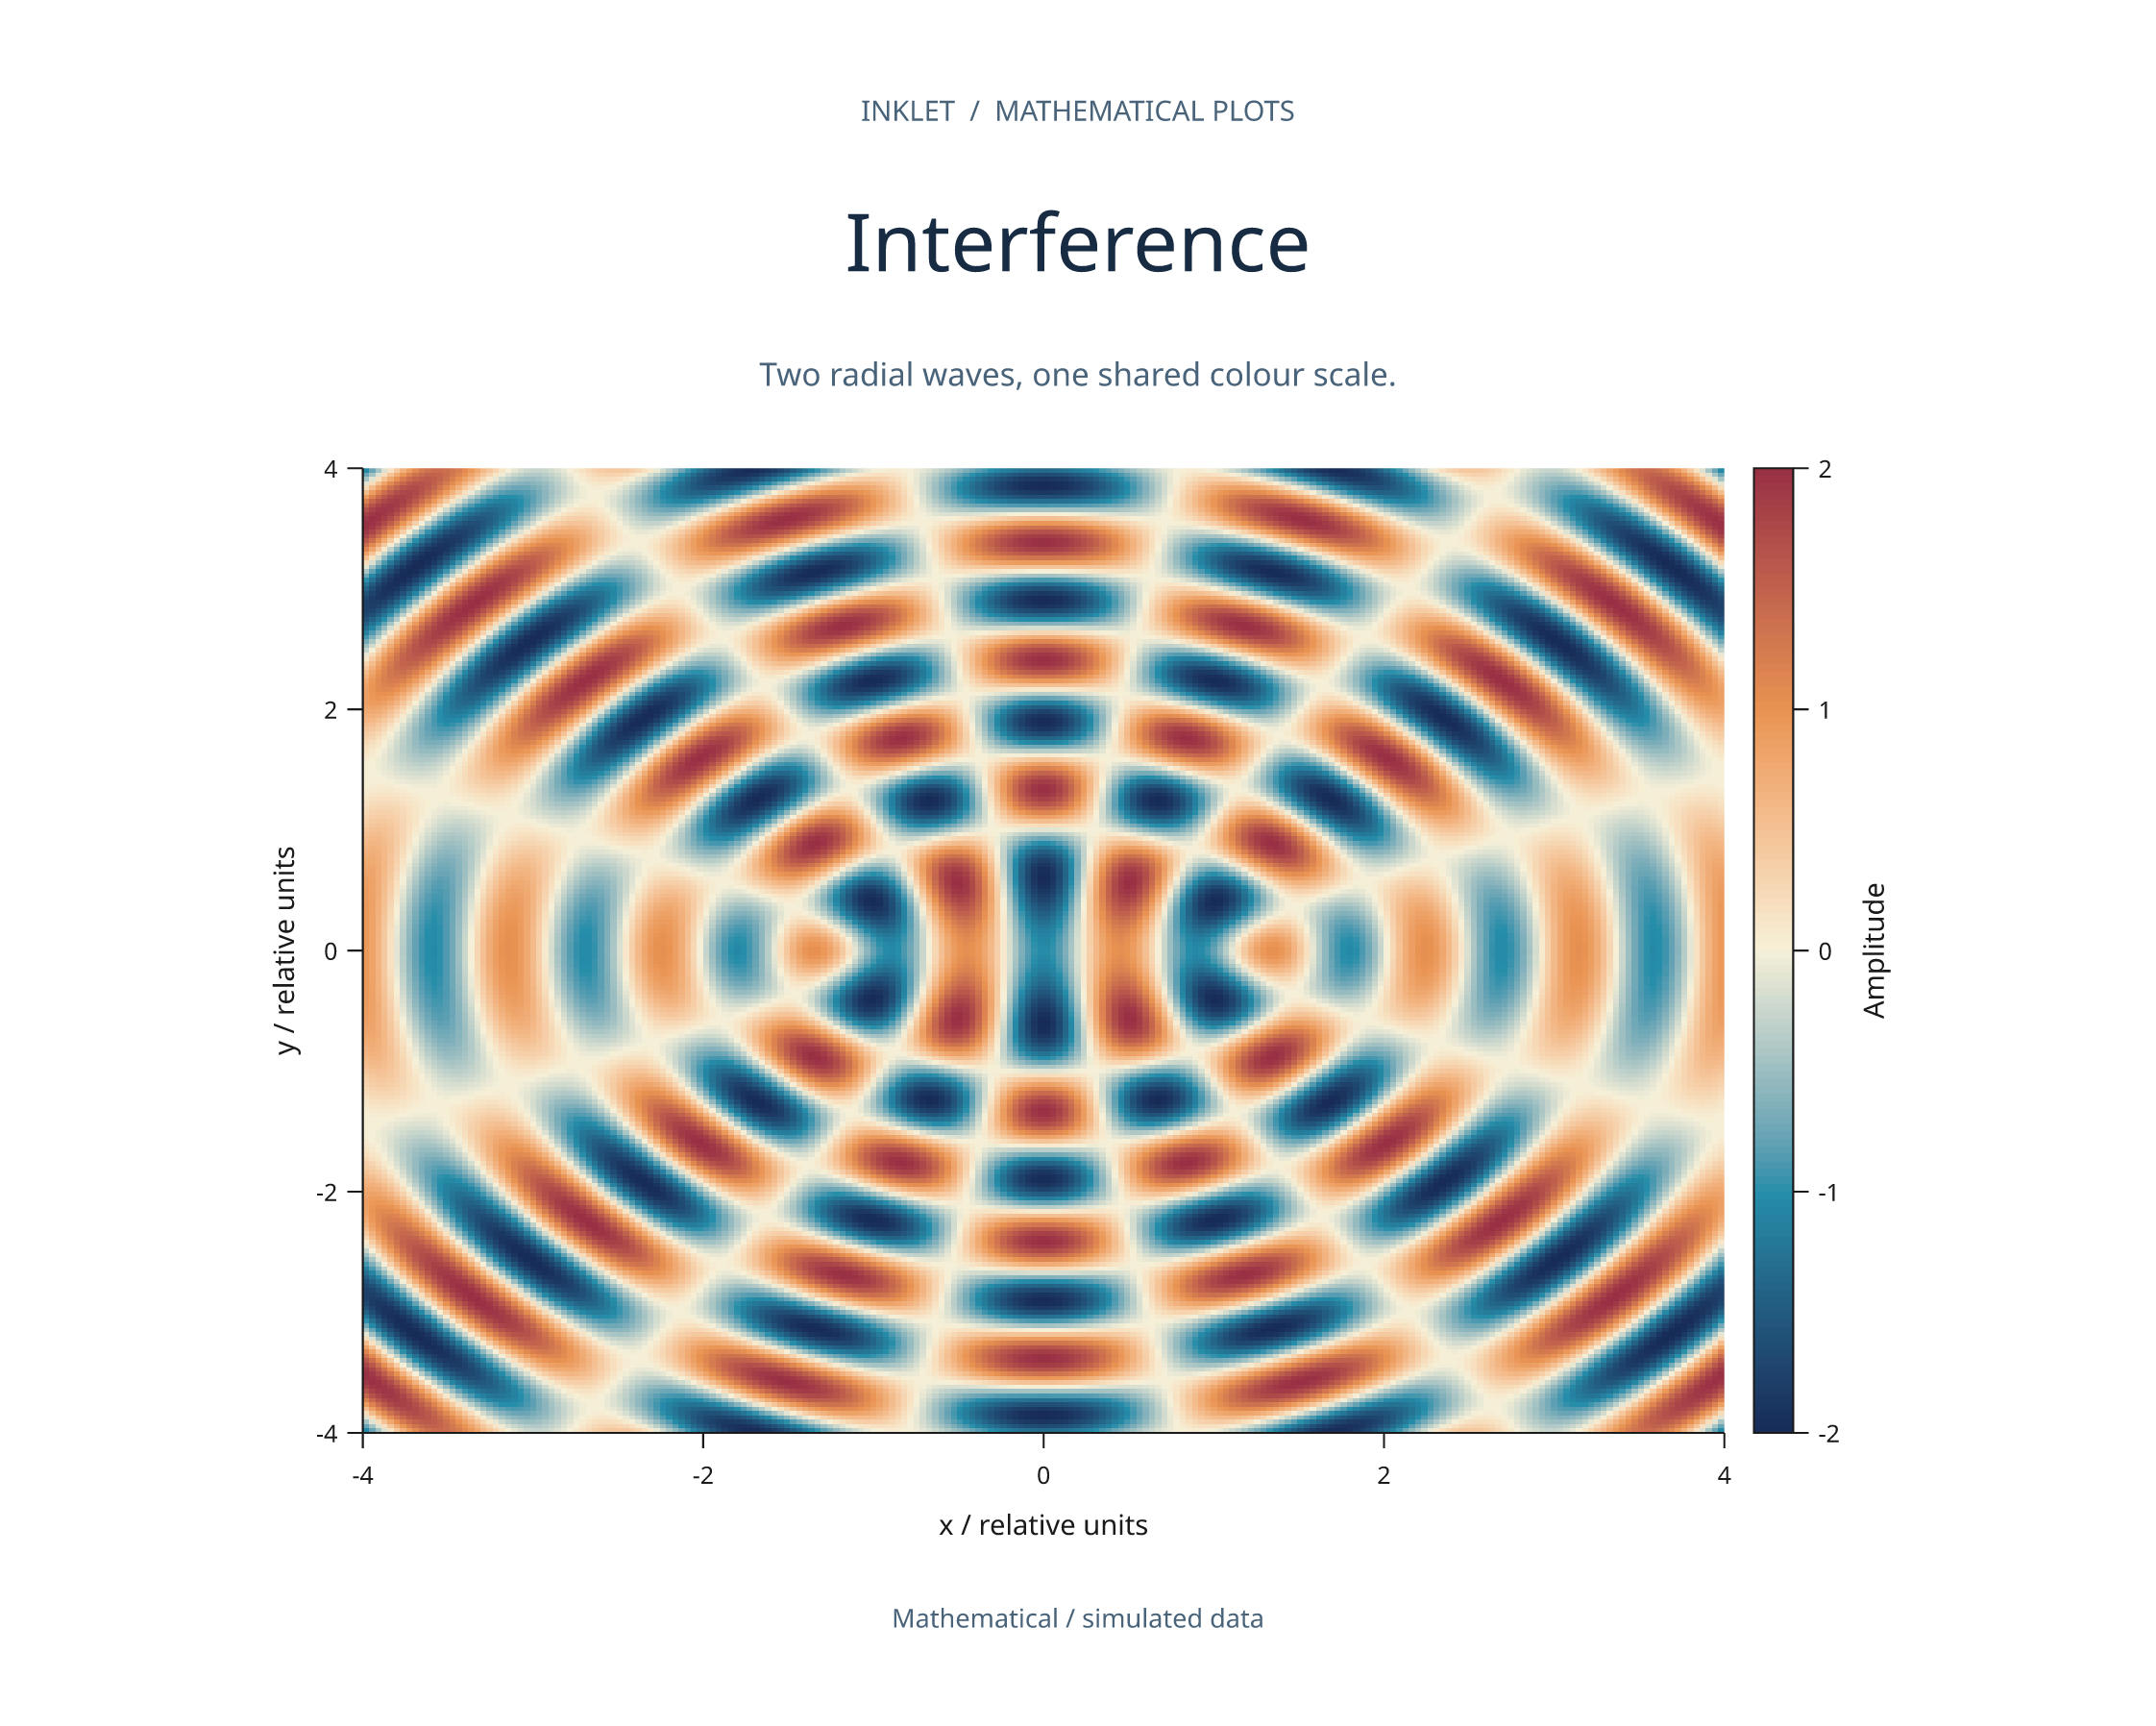
What this figure shows
The colour field is the sum of two analytic radial waves. Both sources use the same spatial grid and colour scale. The matrix is rasterised; axes and the colour bar remain vector elements.
Run the example
Install the rendering extras from the release checkout. This example does not require Blender or downloaded assets. See installation for the release checkout and showcase setup for independent PDF previews.
python -m pip install -e '.[render,images]'
python tools/showcase_gallery.py --only interference --quality final
Open out/showcase/interference/figure.html to review the result. The same folder contains figure.svg, figure.pdf and figure.png.
Adapt it
Change the data definition, ranges or colours in the interference() builder. This is the function used by the gallery recipe:
import math
import inklet as i


def interference():
    n = 220
    axis = [-4 + 8*(k+.5)/n for k in range(n)]
    values = [[math.cos(7*math.hypot(x-1.2,y))+math.cos(7*math.hypot(x+1.2,y))
               for x in axis] for y in axis]
    panel = i.panel(120, 85, x=(-4,4), y=(-4,4))
    panel.matrix(values, x=axis, y=axis, raster=True,
        ramp=i.ramp(['#172b57','#258eaa','#f6f0d8','#e99352','#982f45']), scale=i.linear((-2,2)))
    panel.axes(x='x / relative units', y='y / relative units')
    panel.colorbar(side='right', label='Amplitude', count=5)
    return panel.build()