

On this page
Travelling wave packets
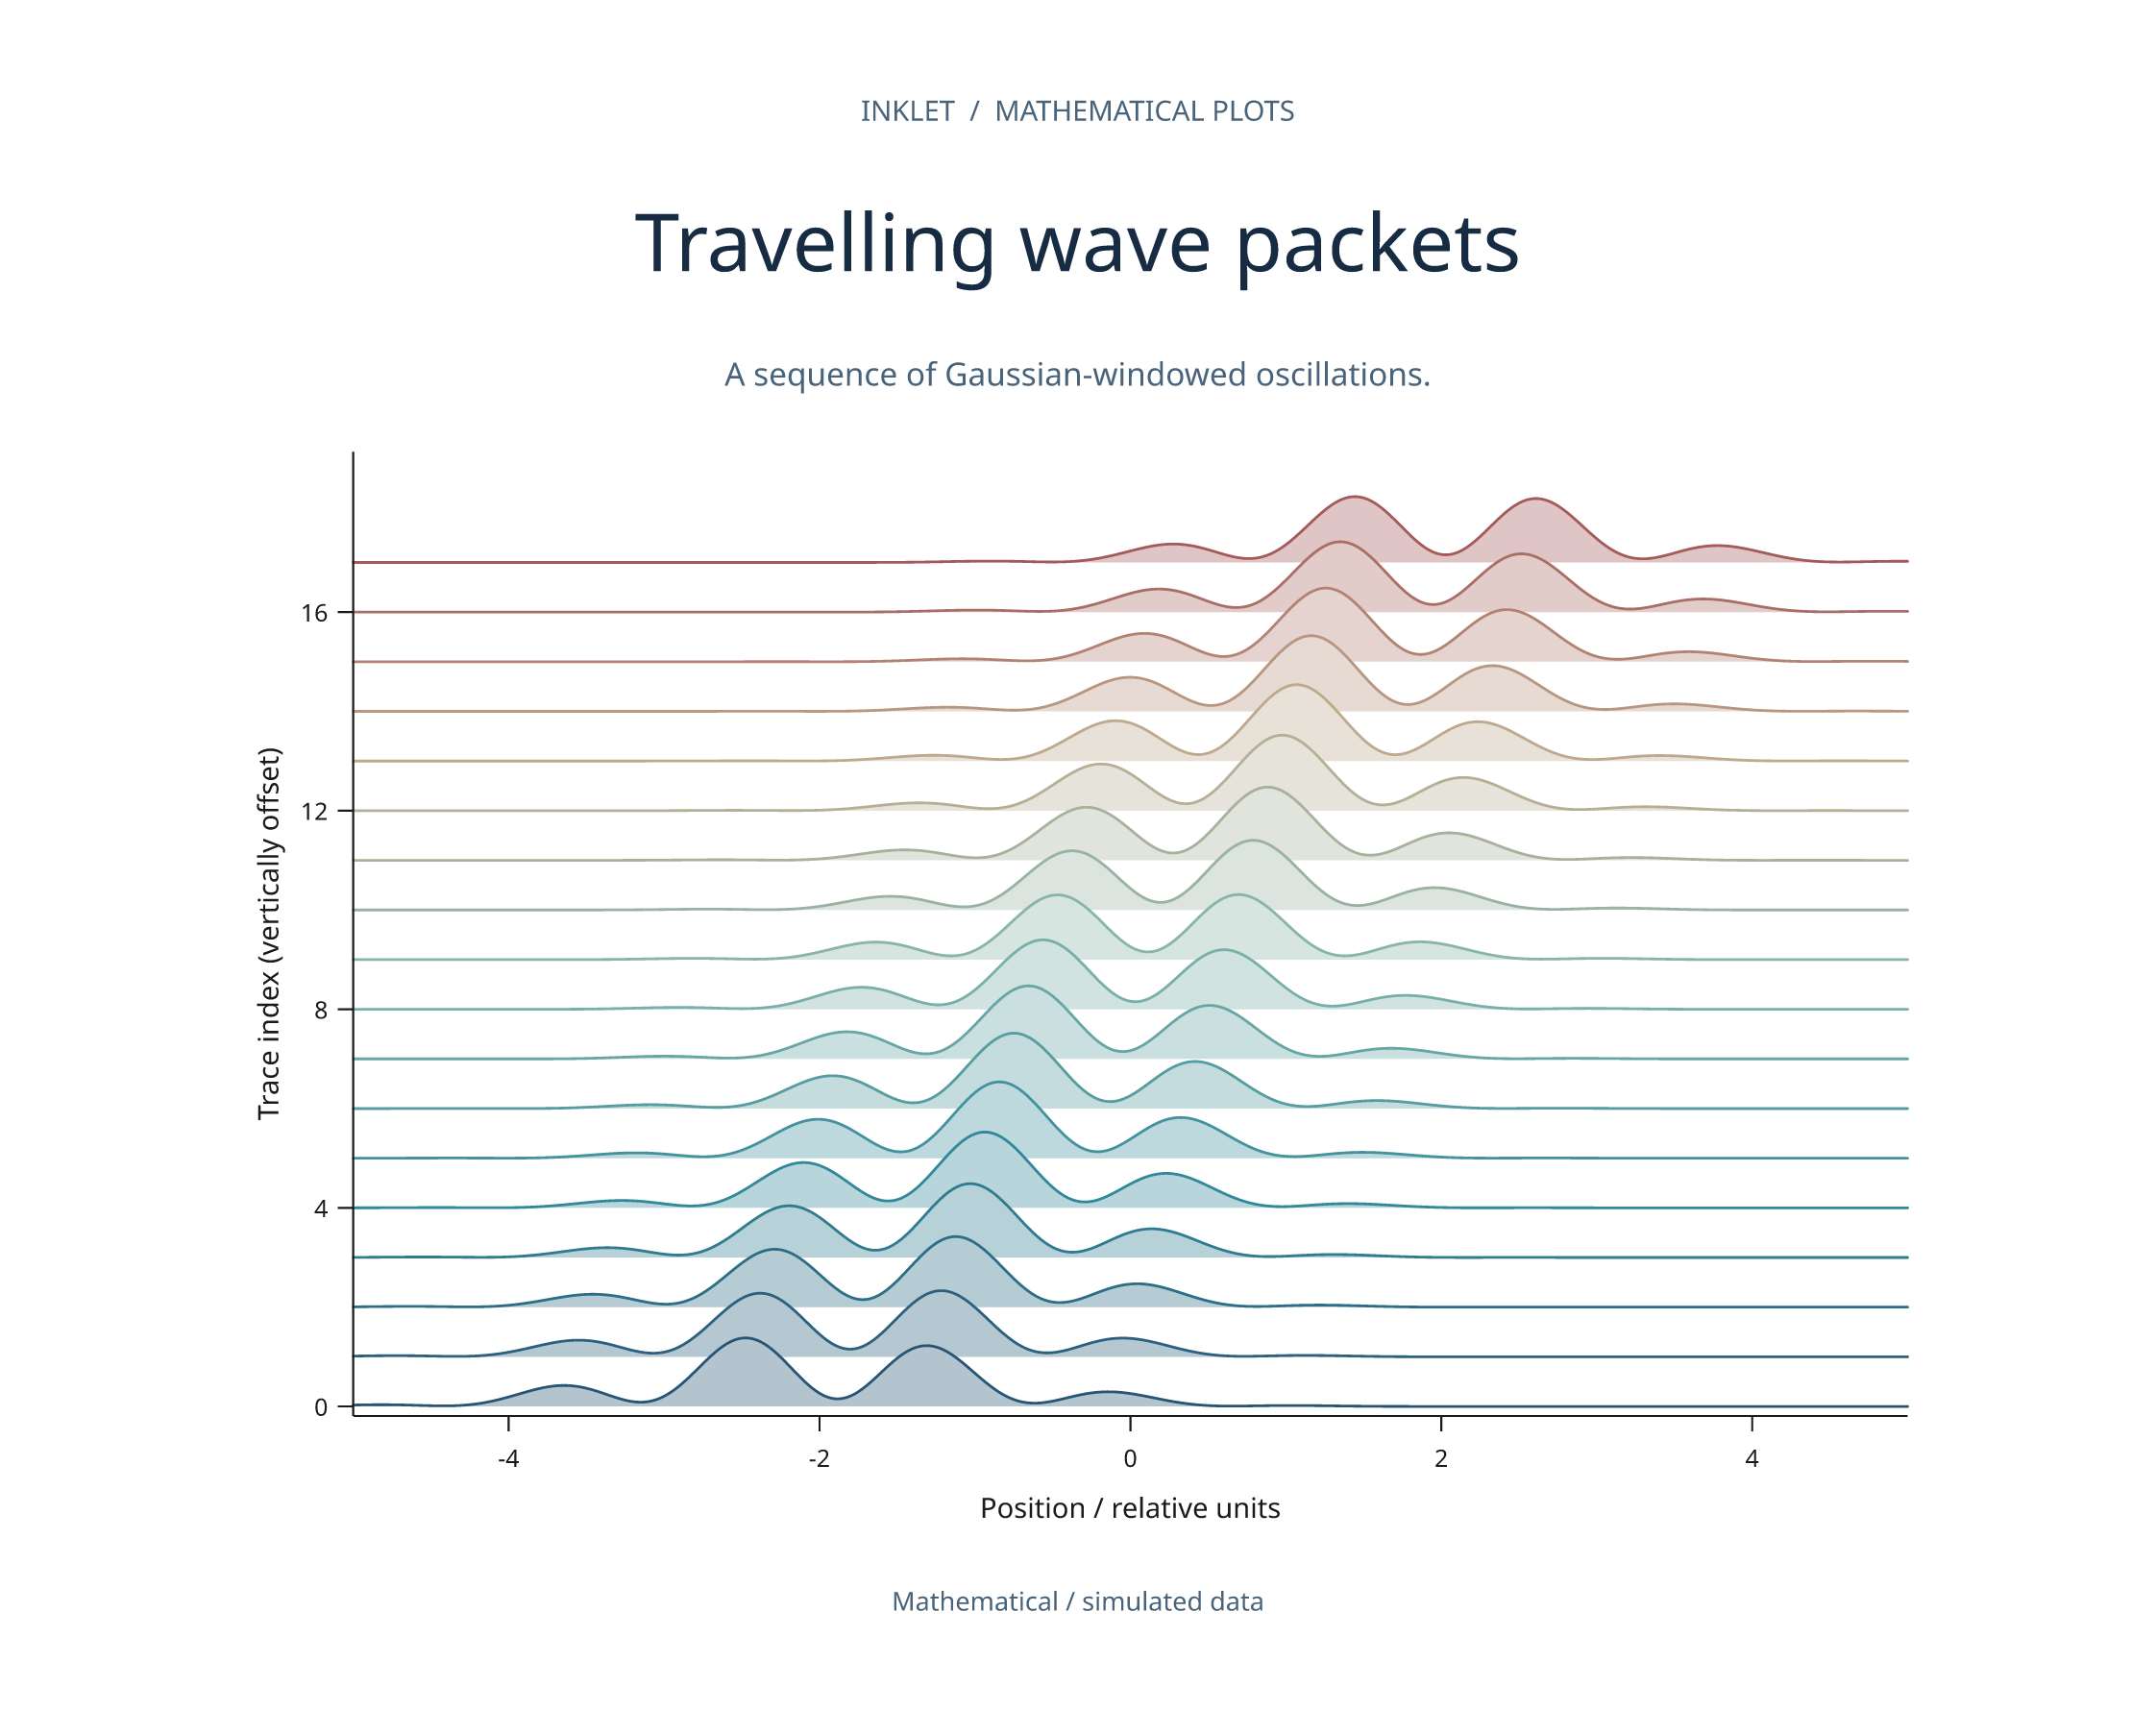
Eighteen offset signals with a consistent drawing order. Inklet 3.0.
What this figure shows
Each trace is a Gaussian-windowed oscillation at a different parameter value. Rear traces are drawn first, so foreground fills cover the correct curves. Vertical offsets separate the signals; they are not amplitude measurements.
Run the example
Install the rendering extras from the release checkout. This example does not require Blender or downloaded assets. See installation for the release checkout and showcase setup for independent PDF previews.
python -m pip install -e '.[render,images]'
python tools/showcase_gallery.py --only wave-packets --quality final
Open out/showcase/wave-packets/figure.html to review the result. The same folder contains figure.svg, figure.pdf and figure.png.
Adapt it
Change the data definition, ranges or colours in the wave_packets() builder. This is the function used by the gallery recipe:
import math
import inklet as i


def wave_packets():
    panel=i.panel(137,85,x=(-5,5),y=(-.1/.52,10/.52))
    xs=[-5+k/40 for k in range(401)]
    ramp=i.ramp(['#285575','#318b9b','#80b4aa','#beaf91','#a45a59'])
    # Paint the upper, rear traces first so foreground peaks stay intact.
    for row in reversed(range(18)):
        t=row/17;offset=row
        ys=[offset+(.8/.52)*math.exp(-((x-(t-.5)*4)/1.5)**2)*(.55+.45*math.cos(5*x-7*t)) for x in xs]
        color=ramp(t)
        panel.fill(list(zip(xs,ys)),baseline=offset,fill=i.mix(color,'white',.65),stroke='none')
        panel.line(list(zip(xs,ys)),stroke=color,stroke_width=.24)
    panel.axis('bottom',label='Position / relative units',ticks=[-4,-2,0,2,4])
    panel.axis('left',label='Trace index (vertically offset)',ticks=[0,4,8,12,16])
    return panel.build()